- Forums
- Product Forums
- General Purpose MicrocontrollersGeneral Purpose Microcontrollers
- i.MX Forumsi.MX Forums
- QorIQ Processing PlatformsQorIQ Processing Platforms
- Identification and SecurityIdentification and Security
- Power ManagementPower Management
- Wireless ConnectivityWireless Connectivity
- RFID / NFCRFID / NFC
- Advanced AnalogAdvanced Analog
- MCX Microcontrollers
- S32G
- S32K
- S32V
- MPC5xxx
- Other NXP Products
- S12 / MagniV Microcontrollers
- Powertrain and Electrification Analog Drivers
- Sensors
- Vybrid Processors
- Digital Signal Controllers
- 8-bit Microcontrollers
- ColdFire/68K Microcontrollers and Processors
- PowerQUICC Processors
- OSBDM and TBDML
- S32M
- S32Z/E
-
- Solution Forums
- Software Forums
- MCUXpresso Software and ToolsMCUXpresso Software and Tools
- CodeWarriorCodeWarrior
- MQX Software SolutionsMQX Software Solutions
- Model-Based Design Toolbox (MBDT)Model-Based Design Toolbox (MBDT)
- FreeMASTER
- eIQ Machine Learning Software
- Embedded Software and Tools Clinic
- S32 SDK
- S32 Design Studio
- GUI Guider
- Zephyr Project
- Voice Technology
- Application Software Packs
- Secure Provisioning SDK (SPSDK)
- Processor Expert Software
- Generative AI & LLMs
-
- Topics
- Mobile Robotics - Drones and RoversMobile Robotics - Drones and Rovers
- NXP Training ContentNXP Training Content
- University ProgramsUniversity Programs
- Rapid IoT
- NXP Designs
- SafeAssure-Community
- OSS Security & Maintenance
- Using Our Community
-
- Cloud Lab Forums
-
- Knowledge Bases
- ARM Microcontrollers
- i.MX Processors
- Identification and Security
- Model-Based Design Toolbox (MBDT)
- QorIQ Processing Platforms
- S32 Automotive Processing Platform
- Wireless Connectivity
- CodeWarrior
- MCUXpresso Suite of Software and Tools
- MQX Software Solutions
- RFID / NFC
- Advanced Analog
-
- NXP Tech Blogs
- Home
- :
- Product Forums
- :
- ColdFire/68K Microcontrollers and Processors
- :
- Re: MCF52235 Execution Time
MCF52235 Execution Time
- Subscribe to RSS Feed
- Mark Topic as New
- Mark Topic as Read
- Float this Topic for Current User
- Bookmark
- Subscribe
- Mute
- Printer Friendly Page
- Mark as New
- Bookmark
- Subscribe
- Mute
- Subscribe to RSS Feed
- Permalink
- Report Inappropriate Content
Hi,
For the MCF52235 at 60 MHz instructions seem to be executing much slower than expected.
I don't have much experience with the ColdFire V2 core and could use some help.
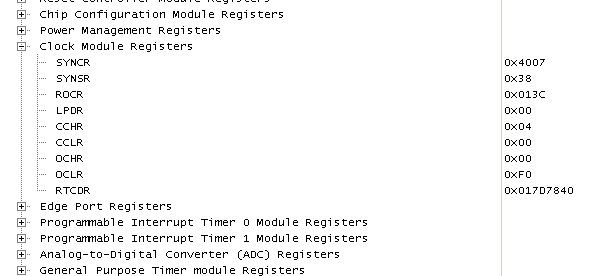
My configuration is an external 25 MHz crystal and then the PLL configured for a 60 MHz system frequency.
The CCHR register is 0x04, so divide external crystal oscillator by 5.
The MFD bits are 100, and RFD bits are 000.
So the system clock should be 25MHz / 5 * 12/1 = 60 MHz.
And indeed the configuration seems correct because the measured CLKOUT signal (pin 1) is 16.6 nsec.
But the instruction execution time looks too slow when a output pin is toggled with know instructions in between.
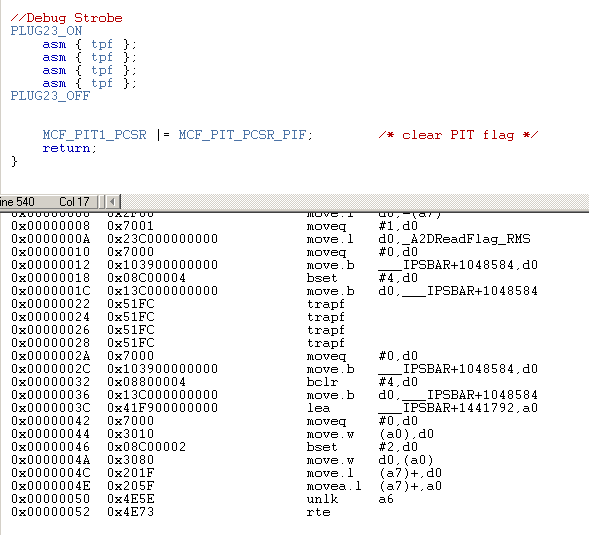
For example: (See the attached C and assembly code)
1) Set output pin high,
2) Execute five trap (trapf) assembly instruction, (1 cycle instruction used instead of NOPs)
3) Set output pin low.
The measured time for the pin to toggle is ~9 uSec.
Based on a 16.6 nSec clock and the number of cycle used between toggling the pin, I would expect the execution time to be well below 200 nsec.
I've tested the timing using the trap, and also with NOPs. Both gave basically the same execution time.
I don't think the processor is getting interrupted between setting the output pin high and then low. The last test I did was to put the test in the pit1ISR and the timing was the same.
Please see the attached code and my clock settings.
Do you agree 9 usec in much too long?
Any ideas what might be causing the problem or how to narrow it down?
Thanks.
Solved! Go to Solution.
- Mark as New
- Bookmark
- Subscribe
- Mute
- Subscribe to RSS Feed
- Permalink
- Report Inappropriate Content
Hi Tom,
You were exactly right, it was an interrupt problem.
The project (for some unknown reason) was enabling the 2nd serial port and interrupt, but there was no interrupt handler and the interrupt was stuck on. As soon as I removed the initialization of the second serial port the problem went away and code executed much-much faster.
Thanks for your help.
- Mark as New
- Bookmark
- Subscribe
- Mute
- Subscribe to RSS Feed
- Permalink
- Report Inappropriate Content
Easy one. You're assuming the GPIO pins can toggle quickly. They can't.
There are "bridges" between the CPU (running on a fast clock) and the peripherals, running on way slower clocks. In the worst case I know of (PXA270) it takes 200 CPU clocks to toggle a GPIO pin.
It isn't so bad on Coldfire, but on some of them it can take 15 clocks.
Some of the chips have "RGPIO" or "Rapid GPIO", which says the normal GPIO isn't. I don't think your chip has this.
So read these for details:
https://community.freescale.com/message/328081#328081
The above also links to:
Re: Help with MCF5475 speed problem.
On V2 processors all accesses to GPIO registers spends I think 12 wait states. On V4 it may be even worse.
overcoming the 12 cycle GPIO waitstate for TFT LCD
Re: MCF5307, execution speed question
The above should help you to get your test code running sensibly.
You should be writing longer loops - do something in a loop 100 times and measure that.
Everything should run in one clock per bus cycle, maybe less sometimes. The only common outliers are the DIV and REMS ones which are 20-35 clocks.
Read the Flash chapter. Flash runs at one cycle per clock. Sort of. One or two. After a 2 clock latency. The SRAM should be single clock.
You should ignore "waving GPIO pins" for testing timing. The best approach is to program a DMA Timer to free-run at 1MHz, and then have your code read the free running (mocrosecond) counter at the start of a test, read at the end, subtract and print. Note that it takes about as long to read a register in the DMA Timer as it does to write to a GPIO port, so you need to calibrate how long the timer reads take (in a loop that does that) and then subtract that from your other tests.
You test that code by waiting until 1,000,000 microsecond counts have happened and then print (or toggle a GPIO), and repeat. It should print once per second.
Assuming all that is OK, are you running RAM or FLASH? At least you don't have a cache to worry about. Getting that wrong on the faster chips can really slow the CPU down.
I'm guessing you're running in RAM. Read "Table 13-3. RAMBAR Field Description" and "Table 11-2. RAMBAR Field Descriptions". Try changing the SRAM priority so the CPU is higher.
Some CPUs need you to set a bit somewhere to let the CPU get to the SRAM via the "back door", or it runs really slow. Your one doesn't seem to do that (luckily), but there is mention in this section, which you should read: "13.6 Internal Bus Arbitration".
- Mark as New
- Bookmark
- Subscribe
- Mute
- Subscribe to RSS Feed
- Permalink
- Report Inappropriate Content
Hi Tom,
Thanks for all the information. This is a part time gig, so I haven't had time yet to look through all the information and links you provided. I did realize there was latency when using the GPIO for timing strobes, but felt the execution delays I was seeing were too long even with the latency considered.
Per your suggestion I measured the instruction execution delay on a bigger scale:
I have code that sets external muxes and reads the A2D 26 times, and in between does calculations with each result. This code executes in 602 usec repeatably as measured with a bit output strobe before and after execution. I made the following changes to the code:
I added 1 trap ( 1 cycle ) instruction after each of the 26 A2D reads. The execution time went from 602 to 633 usec.
I added 2 trap instructions after each of the 26 A2D reads. The execution time went from 633 to 664 usec.
I added 3 trap instructions after each of the 26 A2D reads. The execution time went from 664 to 695 usec.
So for each addition of 26 trap cycles the execution time increased 31 usec. Each trap instruction is adding approximately 31/26 usec = 1.19 usec.
To answer your question. This project is based on the ColdFire Warrior TCPIP Lite Rev 3.2 project. I don't know if it is running out of FLASH or RAM, but will investigate.
Based on the measurements above, instructions are executing 1190nsec / 16.6 nsec = 72 times slower than expected.
Clearly I am missing something.
Your thoughts are welcome.
Thanks again.
- Mark as New
- Bookmark
- Subscribe
- Mute
- Subscribe to RSS Feed
- Permalink
- Report Inappropriate Content
> And indeed the configuration seems correct because the measured CLKOUT signal (pin 1) is 16.6 nsec.
Can't do better than that. Fortunately this is a pretty simple MCU (compared to the i.MX53 I'm working on which has way over 100 separate clocks, all set differently with different enables), and so "Figure 7-1. Clock Module Block Diagram" shows that clock should feed directly into the CPU.
If it is running that slowly then it is having problems fetching its instructions.
Are you running it with the debugger or stand-alone? If the debugger is attached it might be doing something strange like single-stepping the code.
> I don't know if it is running out of FLASH or RAM, but will investigate.
Projects are normally debugged in RAM, then you change the IDE to generate a "release" version that it programs into the FLASH. You should try to benchmark both types.
If you are running in FLASH you should write a benchmark function that you can copy to RAM, or find out how to get the IDE to load a function into RAM and run it from there.
Here's someone else having coldfires running slow. Not a match on your problem, but worth reading:
https://community.freescale.com/message/20169#20169
I'll tell you what it might be. We had a nasty problem here with a bunch of nested interrupts that were triggering one after another. What we didn't expect was that the mainline code was advancing by one instruction for each interrupt service routine executed.
What might be happening to you is that you have an interrupt locked on solid, never getting cleared or disabled. That would mean your mainline code would be running one instruction for each execution of the stuck interrupt service routine. So set the CR to 0x0700 to disable all interrupts and see if the problem goes away.
Tom
- Mark as New
- Bookmark
- Subscribe
- Mute
- Subscribe to RSS Feed
- Permalink
- Report Inappropriate Content
Hi Tom,
You were exactly right, it was an interrupt problem.
The project (for some unknown reason) was enabling the 2nd serial port and interrupt, but there was no interrupt handler and the interrupt was stuck on. As soon as I removed the initialization of the second serial port the problem went away and code executed much-much faster.
Thanks for your help.


