- Forums
- Product Forums
- General Purpose MicrocontrollersGeneral Purpose Microcontrollers
- i.MX Forumsi.MX Forums
- QorIQ Processing PlatformsQorIQ Processing Platforms
- Identification and SecurityIdentification and Security
- Power ManagementPower Management
- MCX Microcontrollers
- S32G
- S32K
- S32V
- MPC5xxx
- Other NXP Products
- Wireless Connectivity
- S12 / MagniV Microcontrollers
- Powertrain and Electrification Analog Drivers
- Sensors
- Vybrid Processors
- Digital Signal Controllers
- 8-bit Microcontrollers
- ColdFire/68K Microcontrollers and Processors
- PowerQUICC Processors
- OSBDM and TBDML
- S32M
-
- Solution Forums
- Software Forums
- MCUXpresso Software and ToolsMCUXpresso Software and Tools
- CodeWarriorCodeWarrior
- MQX Software SolutionsMQX Software Solutions
- Model-Based Design Toolbox (MBDT)Model-Based Design Toolbox (MBDT)
- FreeMASTER
- eIQ Machine Learning Software
- Embedded Software and Tools Clinic
- S32 SDK
- S32 Design Studio
- GUI Guider
- Zephyr Project
- Voice Technology
- Application Software Packs
- Secure Provisioning SDK (SPSDK)
- Processor Expert Software
-
- Topics
- Mobile Robotics - Drones and RoversMobile Robotics - Drones and Rovers
- NXP Training ContentNXP Training Content
- University ProgramsUniversity Programs
- Rapid IoT
- NXP Designs
- SafeAssure-Community
- OSS Security & Maintenance
- Using Our Community
-
- Cloud Lab Forums
-
- Knowledge Bases
- ARM Microcontrollers
- i.MX Processors
- Identification and Security
- Model-Based Design Toolbox (MBDT)
- QorIQ Processing Platforms
- S32 Automotive Processing Platform
- Wireless Connectivity
- CodeWarrior
- MCUXpresso Suite of Software and Tools
- MQX Software Solutions
-
- Home
- :
- i.MX论坛
- :
- i.MX RT 交叉 MCU
- :
- What type of bug could cause SWD / J-Link to stop?
What type of bug could cause SWD / J-Link to stop?
What type of bug could cause SWD / J-Link to stop?
Hi All,
I have a strange bug on my iMXRT1021.
I am using IAR Embedded Workbench, and a J-Link on the SWD debug port.
Under normal operation, everything is fine. The debugger works OK.
I have a bug that I am trying to track down. It occurs fairly regularly. But when it occurs, the system hangs up, and so does the debugger!!
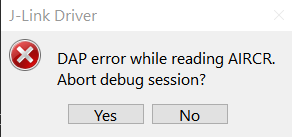
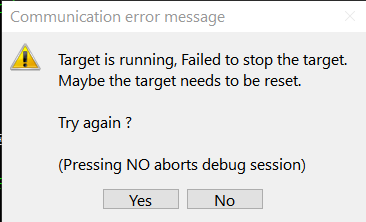
If I hit 'stop', so I can find out where the core is, I get an error message like "Cannot stop target" or "cannot read AICR".
Question - what sort of bug can disable the debug port?
Any ideas?
Thanks,
Chris.
Chris
Do you have peripheral views open? I find that sometimes I get such errors when I stop clocks to peripherals and IAR tries to update the peripheral view but can't due to hardware access failure - usually it would just show non-clocked peripherals with dashes but with the i.MX RT it looks to have problems and loses contact.
Regards
Mark
[uTasker project developer for Kinetis and i.MX RT]
Hi Mark,
Interesting comment - thankyou. I will close all the windows that I can, to minimise Debug activity after the program has halted, and see if that enables the debugger to tell me where it's stopped.
Thanks,
Chris.
Sadly that didn't permit the 'break' function to work. I get this:
Maybe I need to investigate _how_ the CPU _should_ be halted. Sounding like I need to get a logic analyser on the SW bus and try to figure out what is going on. That's a rabbit hole!!
Chris.
Hi Chris,
Thanks for sharing more information. If the RT is going to an unknown state or is trying to access a memory location that it doesn't exist, the debugger might lose control over the RT. Are you able to reproduce this behavior on the RT1020-EVK? If so, could you please share the project with me so I can make some tests on my side to see what might be the root cause of this behavior?
Regards,
Victor
Hi Victor,
Unfortunately I cannot make a code for the RT1020-EVK as the hardware is different and I only see the bug when all of my code is running (Ethernet stack, RF stack, RTOS). If I switch off any part of it, the whole system stops as there is no data passing through.
BUT...
A colleague had a bug that we could solve that had the same symptions:
1. GPIO_PinInit(GPIO1,xxx);
2. CLOCK_ControlGate(kCLOCK_Gpio1,kCLOCK_ClockNotNeeded);
Then either:
a. Use Debugger to inspect Register Map of GPIO1 (debugger = IAR EWARM + J-Link base)
b. variable = GPIO1->register;
Both using the Debugger, or attempting to read a register in the peripheral that was not being clocked caused the Debugger to stop working.
I guess any access (program or Debugger) to a peripheral that is not clocked will cause this problem.
Do you agree?, why is that?, can it be fixed? Surely the debugger should not stop?
Thanks,
Chris.
Hi Chris,
Yes, this is normal behavior. You cannot access to the registers of a peripheral that is not clocked. Please see the following official document from IAR regarding this behavior: https://www.iar.com/support/tech-notes/debugger/accessing-registers-in-an-unclocked-or-powered-down-...
Regards,
Victor
Hi Victor,
Thankyou. That is really helpful. I will have to investigate how it can be trapped in firmware, to see what sort of exception happens when you try to read an unclocked peripheral since the Debugger can't help!
I will also file a bug report with IAR as it seems like a bug.
Regards,
Chris.
Hi Chris,
To give you more accurate support I have a couple of questions.
You mentioned the following: Under normal operation, everything is fine. The debugger works OK. Could you please clarify what is "normal operation"? I'm confused, the debugger works correctly until you make some changes to your application that made your application doesn't work normally? If so, which changes?
If you exit the debug session and you restart your board, does your application works properly?
Just to confirm, your application is not crashing/going to a hard fault it just hangs, correct? Does it always hang in the same part of the code? Are you able to launch the debug session again after this error happens?
Regards,
Victor
Hi Victor,
By 'normal operation', I mean _before_ it hangs. My application can run for 30 minutes, 1 hour, 5 minutes before hanging up. During the time that it is running, the debugger works properly. I can stop, inspect variables, single-step, etc. etc. Everything is perfect.
But when it hangs, (I have UART output which stops when it hangs), pressing 'break' on the Debugger controls gives the error messages above. I cannot tell where the program counter is, so I don't know where it hangs.
So the hang is doing something that is causing the DAP to stop working (I think!!), which seems like a weakness in the DAP! I would expect the DAP to work nomatter where the processor was...
If I restart my board, everything is OK, and it runs normally until it hangs again.
Thanks for any help.
Chris.


