- Forums
- Product Forums
- General Purpose MicrocontrollersGeneral Purpose Microcontrollers
- i.MX Forumsi.MX Forums
- QorIQ Processing PlatformsQorIQ Processing Platforms
- Identification and SecurityIdentification and Security
- Power ManagementPower Management
- MCX Microcontrollers
- S32G
- S32K
- S32V
- MPC5xxx
- Other NXP Products
- Wireless Connectivity
- S12 / MagniV Microcontrollers
- Powertrain and Electrification Analog Drivers
- Sensors
- Vybrid Processors
- Digital Signal Controllers
- 8-bit Microcontrollers
- ColdFire/68K Microcontrollers and Processors
- PowerQUICC Processors
- OSBDM and TBDML
- S32M
-
- Solution Forums
- Software Forums
- MCUXpresso Software and ToolsMCUXpresso Software and Tools
- CodeWarriorCodeWarrior
- MQX Software SolutionsMQX Software Solutions
- Model-Based Design Toolbox (MBDT)Model-Based Design Toolbox (MBDT)
- FreeMASTER
- eIQ Machine Learning Software
- Embedded Software and Tools Clinic
- S32 SDK
- S32 Design Studio
- GUI Guider
- Zephyr Project
- Voice Technology
- Application Software Packs
- Secure Provisioning SDK (SPSDK)
- Processor Expert Software
- MCUXpresso Training Hub
-
- Topics
- Mobile Robotics - Drones and RoversMobile Robotics - Drones and Rovers
- NXP Training ContentNXP Training Content
- University ProgramsUniversity Programs
- Rapid IoT
- NXP Designs
- SafeAssure-Community
- OSS Security & Maintenance
- Using Our Community
-
- Cloud Lab Forums
-
- Knowledge Bases
- ARM Microcontrollers
- i.MX Processors
- Identification and Security
- Model-Based Design Toolbox (MBDT)
- QorIQ Processing Platforms
- S32 Automotive Processing Platform
- Wireless Connectivity
- CodeWarrior
- MCUXpresso Suite of Software and Tools
- MQX Software Solutions
-
- Home
- :
- MCUXpresso软件和工具
- :
- MCUXpresso IDE
- :
- Re: Segger J-Link Debugging Problem
Segger J-Link Debugging Problem
On OSX by using the same FRDM-K22F board and Onboard OpenSDA/J-Link, with KDS 3.2 I can debug w/o problem, but with MCUXpresso 10 I can't. It seems MCUX doesn't provide proper commands to arm-none-eabi-gdb.
I tried the suggestion to delete existing debug configuration and recreate one from Quickstart panel as the following discussion, but it didn't help:
Cannot debug FDRM-K64F via J-link.
See the attachment jlink_setting.png for the debugger setup.
J-Link GDB server connected successfully to the board, and started listening to localhost port 2331.
But arm-none-eabi-gdb didn't send the following command (existed in KDS):
target remote localhost:2331
and as a result MCUX aborts the debugging, shows a misleading message of "Cannot get Jtag device".
Here's the gdb trace:
280,936 2-gdb-version
280,937 ~"GNU gdb (GNU Tools for ARM Embedded Processors) 7.12.0.20161204-git\n"
280,938 ~"Copyright (C) 2016 Free Software Foundation, Inc.\n"
280,938 ~"License GPLv3+: GNU GPL version 3 or later <http://gnu.org/licenses/gpl.html>\nThis is fre\
e software: you are free to change and redistribute it.\nThere is NO WARRANTY, to the extent permitt\
ed by law. Type \"show copying\"\nand \"show warranty\" for details.\n"
280,938 ~"This GDB was configured as \"--host=x86_64-apple-darwin10 --target=arm-none-eabi\".\nType \
\"show configuration\" for configuration details."
280,938 ~"\nFor bug reporting instructions, please see:\n"
280,938 ~"<http://www.gnu.org/software/gdb/bugs/>.\n"
280,938 ~"Find the GDB manual and other documentation resources online at:\n<http://www.gnu.org/soft\
ware/gdb/documentation/>.\n"
280,938 ~"For help, type \"help\".\n"
280,938 ~"Type \"apropos word\" to search for commands related to \"word\".\n"
280,938 2^done
280,938 (gdb)
280,939 3-environment-cd /Users/xxx/tmp/workspaces/mcuxpresso/frdmk22f_hellodemo_apps_hello_worl\
d
280,940 3^done
280,940 (gdb)
280,940 4-gdb-set breakpoint pending on
280,941 4^done
280,941 (gdb)
280,942 5-enable-pretty-printing
280,942 5^done
280,942 (gdb)
280,943 6-gdb-set python print-stack none
280,943 6^done
280,943 (gdb)
280,944 7-gdb-set print object on
280,944 7^done
280,944 (gdb)
280,944 8-gdb-set print sevenbit-strings on
280,945 8^done
280,945 (gdb)
280,945 9-gdb-set charset ISO-8859-1
280,946 9^error,msg="Cannot convert between character sets `UTF-32' and `ISO-8859-1'"
280,946 (gdb)
280,946 10-gdb-set dprintf-style gdb
280,947 10^done
280,947 (gdb)
280,947 11-gdb-set auto-solib-add on
280,947 11^done
280,947 (gdb)
280,950 12-gdb-exit
280,951 12^exit
If I do everything from the command line, by providing "target remote localhost:2331", etc to arm-none-eabi-gdb, debugging is fine.
Also KDS's GDB Client Setup is more flexible than MCUX GDB Client Settings.
KDS has Other options, plus commands, while in MCUX there is no place to enter commands and options.
See kds.png.
Any suggestions how to address this?
Thanks
已解决! 转到解答。
The gdb error "Unknown remote qXfer reply: OK" seems to be related to a timeout of GDB. So maybe your machine somehow is not as fast than others, then it causes the problem (I think). At least I have found it in a OpenOCD post (OpenOCD - Open On-Chip Debugger / Mailing Lists ).
I don't have a Mac, but if it works for KDS, but not for MCUXpresso, I suggest to have a look at the start parameters for GDB. On KDS you can find them in the arm-none-eabi-gdb properties inside the Debug view (see Eclipse and GDB: Process Properties, Arguments and GDB Traces | MCU on Eclipse ). For example I have this:
C:\nxp\KDS_3.2.0\eclipse\../segger/JLinkGDBServerCL -if swd -device MK64FN1M0xxx12 -endian little -speed 1000 -port 2331 -swoport 2332 -telnetport 2333 -vd -ir -localhostonly 1 –s
The paramters in MCUXpresso you can find in the console view:
Executing Server: C:\Program Files (x86)\SEGGER\JLink_V614b\JLinkGDBServerCL.exe -nosilent -swoport 2332 -select USB -telnetport 2333 -endian little -noir -speed auto -port 2331 -vd -device MK64FN1M0xxx12 -if SWD -nohalt -reportuseraction
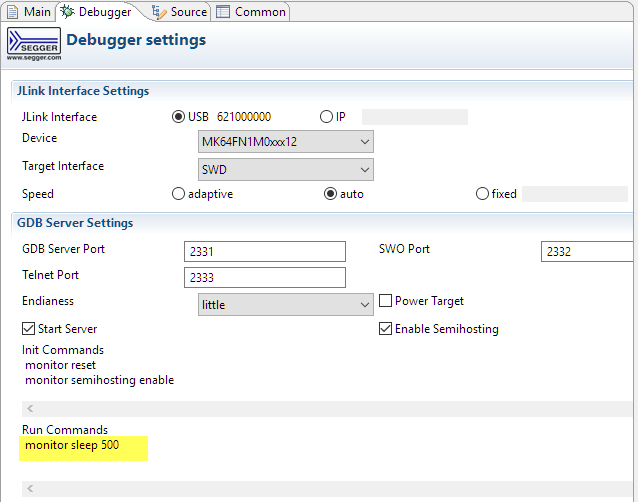
What you might try is to use the monitor sleep command (see Workaround for “Error in final launch sequence: Cannot execute this command without a live selected ... ):
Maybe this helps?
Erich
As detailed in the MCUXpresso IDE User Guide chapter "Debugging a Project" : Use the Quickstart Panel -> Debug option to trigger probe discovery and start a debug session (the "blue" debug button on the toolbar is effectively a shortcut to the Quickstart Panel - Debug option).
We generally do not recommend the use of the standard Eclipse "green" Debug button (unless you really know what you are doing and want to manually set up launch configurations).
Regards,
MCUXpresso IDE Support

