- Forums
- Product Forums
- General Purpose MicrocontrollersGeneral Purpose Microcontrollers
- i.MX Forumsi.MX Forums
- QorIQ Processing PlatformsQorIQ Processing Platforms
- Identification and SecurityIdentification and Security
- Power ManagementPower Management
- MCX Microcontrollers
- S32G
- S32K
- S32V
- MPC5xxx
- Other NXP Products
- Wireless Connectivity
- S12 / MagniV Microcontrollers
- Powertrain and Electrification Analog Drivers
- Sensors
- Vybrid Processors
- Digital Signal Controllers
- 8-bit Microcontrollers
- ColdFire/68K Microcontrollers and Processors
- PowerQUICC Processors
- OSBDM and TBDML
- S32M
-
- Solution Forums
- Software Forums
- MCUXpresso Software and ToolsMCUXpresso Software and Tools
- CodeWarriorCodeWarrior
- MQX Software SolutionsMQX Software Solutions
- Model-Based Design Toolbox (MBDT)Model-Based Design Toolbox (MBDT)
- FreeMASTER
- eIQ Machine Learning Software
- Embedded Software and Tools Clinic
- S32 SDK
- S32 Design Studio
- GUI Guider
- Zephyr Project
- Voice Technology
- Application Software Packs
- Secure Provisioning SDK (SPSDK)
- Processor Expert Software
- MCUXpresso Training Hub
-
- Topics
- Mobile Robotics - Drones and RoversMobile Robotics - Drones and Rovers
- NXP Training ContentNXP Training Content
- University ProgramsUniversity Programs
- Rapid IoT
- NXP Designs
- SafeAssure-Community
- OSS Security & Maintenance
- Using Our Community
-
- Cloud Lab Forums
-
- Knowledge Bases
- ARM Microcontrollers
- i.MX Processors
- Identification and Security
- Model-Based Design Toolbox (MBDT)
- QorIQ Processing Platforms
- S32 Automotive Processing Platform
- Wireless Connectivity
- CodeWarrior
- MCUXpresso Suite of Software and Tools
- MQX Software Solutions
-
- Home
- :
- MCUXpresso Software and Tools
- :
- MCUXpresso IDE
- :
- Error No source available for "(gdb[2].proc[42000].threadGroup[i1],gdb[2].proc[42000].OSthread[1]).thread[1].frame[0]" during debugging start
Error No source available for "(gdb[2].proc[42000].threadGroup[i1],gdb[2].proc[42000].OSthread[1]).thread[1].frame[0]" during debugging start
- Subscribe to RSS Feed
- Mark Topic as New
- Mark Topic as Read
- Float this Topic for Current User
- Bookmark
- Subscribe
- Mute
- Printer Friendly Page
Error No source available for "(gdb[2].proc[42000].threadGroup[i1],gdb[2].proc[42000].OSthread[1]).thread[1].frame[0]" during debugging start
- Mark as New
- Bookmark
- Subscribe
- Mute
- Subscribe to RSS Feed
- Permalink
- Report Inappropriate Content
I am using MCUXpresso IDE v11.1.1 [Build 3241] [2020-03-02] on Windows 10 computer with LPCXpresso LPC-Link 2 as a debug tool and NXP Kinetis K8x MCU as a target. When I start the debug session, after uploading, I get the following error (you can also check the screenshot in attachment):
No source available for "(gdb[2].proc[42000].threadGroup[i1],gdb[2].proc[42000].OSthread[1]).thread[1].frame[0]"
With pressing buttons Suspend and Resume I get the following error:
Break at address "0x1c00520e" with no debug information available, or outside of program code.
While Console shows the message
[MCUXpresso Semihosting Telnet console for 'EOS_K8x LinkServer Debug Build' started on port 51504 @ 127.0.0.1]
Debugger Console shows the following:
C:\mcuxpresso\MCUXpressoIDE_11.1.1_3241\ide\plugins\com.nxp.mcuxpresso.tools.win32_11.1.0.202001081728 ools in rm-none-eabi-gdb.exe: warning: Couldn't determine a path for the index cache directory.
GNU gdb (GNU Tools for Arm Embedded Processors 8-2019-q3-update) 8.3.0.20190703-git
Copyright (C) 2019 Free Software Foundation, Inc.
License GPLv3+: GNU GPL version 3 or later <http://gnu.org/licenses/gpl.html>
This is free software: you are free to change and redistribute it.
There is NO WARRANTY, to the extent permitted by law.
Type "show copying" and "show warranty" for details.
This GDB was configured as "--host=i686-w64-mingw32 --target=arm-none-eabi".
Type "show configuration" for configuration details.
For bug reporting instructions, please see:
<http://www.gnu.org/software/gdb/bugs/>.
Find the GDB manual and other documentation resources online at:
<http://www.gnu.org/software/gdb/documentation/>.For help, type "help".
Type "apropos word" to search for commands related to "word".Program stopped.
0x1c0001ec in ?? ()Program received signal SIGINT, Interrupt.
0x1c00520e in ?? ()
I have experienced similar issues with MCUXpresso IDE v10.3.1. However, repetitive pressing of the buttons Suspend, Resume, and Restart helped to proceed with debugging in most of the cases.
How to resolve this problem?
- Mark as New
- Bookmark
- Subscribe
- Mute
- Subscribe to RSS Feed
- Permalink
- Report Inappropriate Content
I am getting the same problem, but it looks like my flash is not getting written at all.
Opening flash driver MIMXRT1060_SFDP_QSPI.cfx
Sending VECTRESET to run flash driver
Flash variant 'JEDEC_SFDP_Device' detected (16MB = 256*64K at 0x60000000)
Closing flash driver MIMXRT1060_SFDP_QSPI.cfx
Connected: was_reset=false. was_stopped=true
Awaiting telnet connection to port 3330 ...
GDB nonstop mode enabled
Opening flash driver MIMXRT1060_SFDP_QSPI.cfx (already resident)
Sending VECTRESET to run flash driver
Flash variant 'JEDEC_SFDP_Device' detected (16MB = 256*64K at 0x60000000)
Writing 67436 bytes to address 0x60000000 in Flash
Sectors written: 0, unchanged: 2, total: 2
Erased/Wrote sector 0-1 with 67436 bytes in 34msec
Closing flash driver MIMXRT1060_SFDP_QSPI.cfx
Flash Write Done
Flash Program Summary: 67436 bytes in 0.03 seconds (1936.93 KB/sec)
Starting execution using system reset and halt target
Stopped (Was Reset) [Reset from Unknown]
Is there a solution you can refer me that will guild regarding setting flash driver.
- Mark as New
- Bookmark
- Subscribe
- Mute
- Subscribe to RSS Feed
- Permalink
- Report Inappropriate Content
From the log you have posted, the same image is already loaded into flash and so it is not being re-written:
Writing 67436 bytes to address 0x60000000 in Flash
Sectors written: 0, unchanged: 2, total: 2 <-- this means the same data is already in flash, so it is not re-written!
The problem is more likely that your application is not setting up its vector table correctly. You will have to place a breakpoint on ResetISR and debug from reset.
- Mark as New
- Bookmark
- Subscribe
- Mute
- Subscribe to RSS Feed
- Permalink
- Report Inappropriate Content
I tried to debug in ResetISR, looks like I don't go in ResetISR as well.
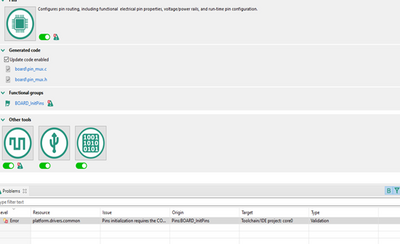
Does it has anything to do with this error,
Issue: Pins initialization requires the COMMON Driver in the project.
Level: Error
Type: Validation
Tool: Toolchain/IDE project
Origin: Pins:BOARD_InitPins
Target: Toolchain/IDE project: core0
Resource: platform.drivers.common
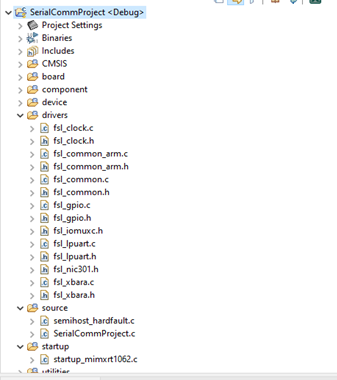
I installed the common drivers,
not sure what I am missing, or how can I debug at least.
- Mark as New
- Bookmark
- Subscribe
- Mute
- Subscribe to RSS Feed
- Permalink
- Report Inappropriate Content
Hello Pavlo Kostrytsia
Can you help me showing me the debug log messages?
To display this log, select the Console and then click to view the various options (as below).
The debug log displays a large amount of information that can be useful in tracking down issues.
Does the same error appear when you debug an SDK example?
Please let me know your findings.
Best regards,
Omar
- Mark as New
- Bookmark
- Subscribe
- Mute
- Subscribe to RSS Feed
- Permalink
- Report Inappropriate Content
Hi nxf54944,
The content of debug messages is the following (from MCUXpresso 10.3.1):
MCUXpresso IDE RedlinkMulti Driver v10.3 (Feb 7 2019 22:50:02 - crt_emu_cm_redlink build 760)
Found chip XML file in C:/projects/eos/host/eos-k8x/src/Debug Build\MK80FN256xxx15.xml
Reconnected to existing link server
Connecting to probe 1 core 0 (using server started externally) gave 'OK'
============= SCRIPT: kinetisconnect.scp =============
Kinetis Connect Script
Connecting to Probe Index = 1
This probe = 1
This TAP = 0
This core = 0
DpID = 2BA01477
Assert NRESET
Reset pin state: 00
Power up Debug
MDM-AP APID: 0x001C0000
MDM-AP System Reset/Hold Reset/Debug Request
MDM-AP Control: 0x0000001C
MDM-AP Status (Flash Ready) : 0x00000032
Part is not secured
MDM-AP Control: 0x00000014
Release NRESET
Reset pin state: 01
MDM-AP Control (Debug Request): 0x00000004
MDM-AP Status: 0x0001003A
MDM-AP Core Halted
============= END SCRIPT =============================
Probe Firmware: LPC-LINK2 CMSIS-DAP V5.224 (NXP Semiconductors)
Serial Number: I3F4A1CW
VID:PID: 1FC9:0090
USB Path: \\?\hid#vid_1fc9&pid_0090&mi_00#7&34848940&0&0000#{4d1e55b2-f16f-11cf-88cb-001111000030}
Using memory from core 0 after searching for a good core
debug interface type = Cortex-M3/4 (DAP DP ID 2BA01477) over SWD TAP 0
processor type = Cortex-M4 (CPU ID 00000C24) on DAP AP 0
number of h/w breakpoints = 6
number of flash patches = 2
number of h/w watchpoints = 4
Probe(0): Connected&Reset. DpID: 2BA01477. CpuID: 00000C24. Info: <None>
Debug protocol: SWD. RTCK: Disabled. Vector catch: Disabled.
Content of CoreSight Debug ROM(s):
RBASE E00FF000: CID B105100D PID 04000BB4C4 ROM (type 0x1)
ROM 1 E000E000: CID B105E00D PID 04000BB00C Gen SCS (type 0x0)
ROM 1 E0001000: CID B105E00D PID 04003BB002 Gen DWT (type 0x0)
ROM 1 E0002000: CID B105E00D PID 04002BB003 Gen FPB (type 0x0)
ROM 1 E0000000: CID B105E00D PID 04003BB001 Gen ITM (type 0x0)
ROM 1 E0040000: CID B105900D PID 04000BB9A1 CSt TPIU type 0x11 Trace Sink - TPIU
ROM 1 E0041000: CID B105900D PID 04000BB925 CSt ETM type 0x13 Trace Source - Core
NXP: MK80FN256xxx15
DAP stride is 4096 bytes (1024 words)
Inspected v.2 On chip Kinetis Flash memory module FTFA_4K.cfx
Image 'Kinetis SemiGeneric Feb 17 2017 17:24:01'
Opening flash driver FTFA_4K.cfx
Sending VECTRESET to run flash driver
Flash variant 'K 80 FTFA Generic 4K' detected (1MB = 256*4K at 0x0)
Closing flash driver FTFA_4K.cfx
Connected: was_reset=true. was_stopped=true
Awaiting telnet connection to port 3330 ...
GDB nonstop mode enabled
Opening flash driver FTFA_4K.cfx (already resident)
Sending VECTRESET to run flash driver
Flash variant 'K 80 FTFA Generic 4K' detected (1MB = 256*4K at 0x0)
Writing 210124 bytes to address 0x00000000 in Flash
00002000 done 3% (8192 out of 210124)
00004000 done 7% (16384 out of 210124)
00006000 done 11% (24576 out of 210124)
00008000 done 15% (32768 out of 210124)
0000A000 done 19% (40960 out of 210124)
0000C000 done 23% (49152 out of 210124)
0000E000 done 27% (57344 out of 210124)
00010000 done 31% (65536 out of 210124)
00012000 done 35% (73728 out of 210124)
00014000 done 38% (81920 out of 210124)
00016000 done 42% (90112 out of 210124)
00018000 done 46% (98304 out of 210124)
0001A000 done 50% (106496 out of 210124)
0001C000 done 54% (114688 out of 210124)
0001E000 done 58% (122880 out of 210124)
00020000 done 62% (131072 out of 210124)
00022000 done 66% (139264 out of 210124)
00024000 done 70% (147456 out of 210124)
00026000 done 74% (155648 out of 210124)
00028000 done 77% (163840 out of 210124)
0002A000 done 81% (172032 out of 210124)
0002C000 done 85% (180224 out of 210124)
0002E000 done 89% (188416 out of 210124)
00030000 done 93% (196608 out of 210124)
00032000 done 97% (204800 out of 210124)
00034000 done 100% (212992 out of 210124)
Erased/Wrote sector 0-51 with 210124 bytes in 6235msec
Closing flash driver FTFA_4K.cfx
Flash Write Done
Flash Program Summary: 210124 bytes in 6.24 seconds (32.91 KB/sec)
Starting execution using system reset and halt target
Stopped (Was Reset) [Reset from Unknown]
I am not sure how I can run SDK examples on the custom board I am using in my project.
Thanks.
- Mark as New
- Bookmark
- Subscribe
- Mute
- Subscribe to RSS Feed
- Permalink
- Report Inappropriate Content
Hello Pavlo Kostrytsia
For the information you provided, it seems that the mcu's stuck on the bootloader. You can confirm it looking into the PC register.
Being stuck in the bootloader could mean:
- Your application is not valid
- You have some other hardware issue on your board
Do you have enabled the bootloader pin?
Also please check the FOPT register, is useful leave it with the value of 00b or 11b
Let me know if this is helpful. If you have more questions do not hesitate to ask me.
Best regards,
Omar


