- Forums
- Product Forums
- General Purpose MicrocontrollersGeneral Purpose Microcontrollers
- i.MX Forumsi.MX Forums
- QorIQ Processing PlatformsQorIQ Processing Platforms
- Identification and SecurityIdentification and Security
- Power ManagementPower Management
- MCX Microcontrollers
- S32G
- S32K
- S32V
- MPC5xxx
- Other NXP Products
- Wireless Connectivity
- S12 / MagniV Microcontrollers
- Powertrain and Electrification Analog Drivers
- Sensors
- Vybrid Processors
- Digital Signal Controllers
- 8-bit Microcontrollers
- ColdFire/68K Microcontrollers and Processors
- PowerQUICC Processors
- OSBDM and TBDML
- S32M
-
- Solution Forums
- Software Forums
- MCUXpresso Software and ToolsMCUXpresso Software and Tools
- CodeWarriorCodeWarrior
- MQX Software SolutionsMQX Software Solutions
- Model-Based Design Toolbox (MBDT)Model-Based Design Toolbox (MBDT)
- FreeMASTER
- eIQ Machine Learning Software
- Embedded Software and Tools Clinic
- S32 SDK
- S32 Design Studio
- GUI Guider
- Zephyr Project
- Voice Technology
- Application Software Packs
- Secure Provisioning SDK (SPSDK)
- Processor Expert Software
- MCUXpresso Training Hub
-
- Topics
- Mobile Robotics - Drones and RoversMobile Robotics - Drones and Rovers
- NXP Training ContentNXP Training Content
- University ProgramsUniversity Programs
- Rapid IoT
- NXP Designs
- SafeAssure-Community
- OSS Security & Maintenance
- Using Our Community
-
- Cloud Lab Forums
-
- Knowledge Bases
- ARM Microcontrollers
- i.MX Processors
- Identification and Security
- Model-Based Design Toolbox (MBDT)
- QorIQ Processing Platforms
- S32 Automotive Processing Platform
- Wireless Connectivity
- CodeWarrior
- MCUXpresso Suite of Software and Tools
- MQX Software Solutions
-
- Home
- :
- MCUXpresso Software and Tools
- :
- MCUXpresso IDE
- :
- Cannot create GDB SEGGER Interface Debugging Configuration
Cannot create GDB SEGGER Interface Debugging Configuration
- Subscribe to RSS Feed
- Mark Topic as New
- Mark Topic as Read
- Float this Topic for Current User
- Bookmark
- Subscribe
- Mute
- Printer Friendly Page
- Mark as New
- Bookmark
- Subscribe
- Mute
- Subscribe to RSS Feed
- Permalink
- Report Inappropriate Content
Hello!
I am having a problem creating a new GDB SEGGER Interface Debugging configuration. Whenever I try to create a new one I get prompted with the message:
The launch configuration 'project_name' is incompatible with this version of MCUXpresso IDE.
Migrate the launch configuration the the supported format?
If you hit yes it lets you fill out the different available fields, but once you hit "Debug" to start your session you are hit with the same message again, and prompted to delete the invalid configuration and start over, thus getting stuck in an unending loop where no progress is made.
I was having this problem in v11.6.2, and recently updated to version v11.9.0 in hopes of fixing it. To my surprise I get the exact same problem, even after performing a clean install (I essentially purged the previous install and all the workspace configurations).
Is this a known problem? I am having some issues debugging FreeRTOS on a stock eclipse install (session hangs if I halt execution) so I wanted to try my luck with MCUXpresso.
I am running Ubuntu 22.04, and my target is the LPC54607J256.
Thank you.
Solved! Go to Solution.
- Mark as New
- Bookmark
- Subscribe
- Mute
- Subscribe to RSS Feed
- Permalink
- Report Inappropriate Content
- Mark as New
- Bookmark
- Subscribe
- Mute
- Subscribe to RSS Feed
- Permalink
- Report Inappropriate Content
Hello @mgfernandez
Sorry for the inconvenient to you.
For MCUXpresso IDE, recommend use blue bug icon to debug.
In <MCUXpresso_IDE_User_Guide.pdf>, there is a note:
BR
Alice
- Mark as New
- Bookmark
- Subscribe
- Mute
- Subscribe to RSS Feed
- Permalink
- Report Inappropriate Content
- Mark as New
- Bookmark
- Subscribe
- Mute
- Subscribe to RSS Feed
- Permalink
- Report Inappropriate Content
Hi, @mgfernandez
Did you switch to another project for debugging, or are you just having problems debugging FreeRTOS? I used the development board to do a simple led_blinky test, wrote the development board download firmware as SEGGER Jlink, and created a new GDB SEGGER Jlink for debugging, and the program ran normally.
Can you provide more details on the problem? If convenient, please take a screenshot of the problem encountered.
Best regards, Alex
- Mark as New
- Bookmark
- Subscribe
- Mute
- Subscribe to RSS Feed
- Permalink
- Report Inappropriate Content
Creating a project from the SDK for the LPCXpresso54628 board allows me to create a configuration using the blue debug button, and I can go into a debug session with no issues.
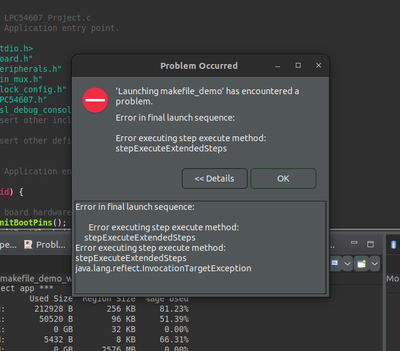
If I modify that generated configuration to work with my makefile based project and copy it to the project, after launching it I get the following error:
I also tried making an empty project from the SDK targetting my desired processor and could download it and debug it into my custom board. I decided to try and edit that configuration to use it on my project but that one also got the error above once I got to actually trying it out.
If I hit the blue debug button to generate a configuration on my makefile project (the one I'm actually trying to debug), after I get prompted to select a connected probe, nothing happens. I know this is not working right because if I do the exact same process with a project created from the SDK I can actually generate a debug configuration using that button.
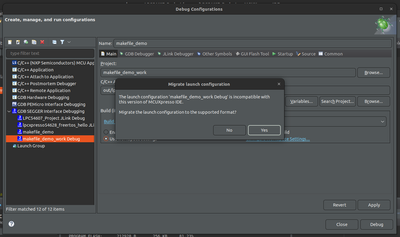
If I got through the green button and try to generate a new configuration from scratch, I get the following:
This happens just after double clicking the GDB SEGGER Interface Debugging option on the left panel to create a new configuration. If you hit yes it lets you edit values but once you get to actually trying it out it goes into the loop I described in my initial post.
For reference, I can debug this project on a vanilla version of eclipse utilising Eclipse CDT tools (GDB SEGGER J-Link Debugging option), I am just having issues with the debug session hanging when the RTOS is running and I try to halt the session and restart it. This is why I came back to MCUXpresso to try out the debugging here, but the project is the same, so there is nothing inherently wrong about it, the code works and can be debugged.
Could there be something about my project, which is not an SDK project, that causes these issues?
- Mark as New
- Bookmark
- Subscribe
- Mute
- Subscribe to RSS Feed
- Permalink
- Report Inappropriate Content
How are you generating the debug configuration? I suggest that you let the IDE create it (e.g. using the quickstart panel, or delete all .launch and start a debug session).
That error message you describe is something I would get if you create manually an incompatible debug session in the run/launch configuration dialog of Eclipse. If you do it there, make sure you create it under 'GDB SEGGER Interface Debugging':
This because the MCUXpresso IDE uses an extended debug configuration.
You can create other debug configurations too (as you see in my screenshot for 'GDB SEGGER J-Link Debugging' on the bottom, but then you have to use the 'green debug toolbar icon' and not the 'blue' on, or manually launch it. Because the IDE otherwise wants to launch its own configuration type.
I hope this helps,
Erich
- Mark as New
- Bookmark
- Subscribe
- Mute
- Subscribe to RSS Feed
- Permalink
- Report Inappropriate Content
The tl;dr is that yes I've tried what you are describing and I am not having much luck. I tend to use the green button on custom boards, but I am getting the error I described when I double click the option you mention to start creating a new configuration. It can't possible be an invalid configuration if I just essentially clicked "new". There seems to be an incompatibility with how my project is set up and what the ide expects. If I follow this same process in vanilla eclipse with the CDT tools I can generate a configuration and debug, but I'm having some trouble getting the session to not hang while debugging freertos and that's why I am trying the NXP tool again


