- Forums
- Product Forums
- General Purpose MicrocontrollersGeneral Purpose Microcontrollers
- i.MX Forumsi.MX Forums
- QorIQ Processing PlatformsQorIQ Processing Platforms
- Identification and SecurityIdentification and Security
- Power ManagementPower Management
- MCX Microcontrollers
- S32G
- S32K
- S32V
- MPC5xxx
- Other NXP Products
- Wireless Connectivity
- S12 / MagniV Microcontrollers
- Powertrain and Electrification Analog Drivers
- Sensors
- Vybrid Processors
- Digital Signal Controllers
- 8-bit Microcontrollers
- ColdFire/68K Microcontrollers and Processors
- PowerQUICC Processors
- OSBDM and TBDML
- S32M
-
- Solution Forums
- Software Forums
- MCUXpresso Software and ToolsMCUXpresso Software and Tools
- CodeWarriorCodeWarrior
- MQX Software SolutionsMQX Software Solutions
- Model-Based Design Toolbox (MBDT)Model-Based Design Toolbox (MBDT)
- FreeMASTER
- eIQ Machine Learning Software
- Embedded Software and Tools Clinic
- S32 SDK
- S32 Design Studio
- GUI Guider
- Zephyr Project
- Voice Technology
- Application Software Packs
- Secure Provisioning SDK (SPSDK)
- Processor Expert Software
- MCUXpresso Training Hub
-
- Topics
- Mobile Robotics - Drones and RoversMobile Robotics - Drones and Rovers
- NXP Training ContentNXP Training Content
- University ProgramsUniversity Programs
- Rapid IoT
- NXP Designs
- SafeAssure-Community
- OSS Security & Maintenance
- Using Our Community
-
- Cloud Lab Forums
-
- Knowledge Bases
- ARM Microcontrollers
- i.MX Processors
- Identification and Security
- Model-Based Design Toolbox (MBDT)
- QorIQ Processing Platforms
- S32 Automotive Processing Platform
- Wireless Connectivity
- CodeWarrior
- MCUXpresso Suite of Software and Tools
- MQX Software Solutions
-
- Home
- :
- MCUXpresso软件和工具
- :
- MCUXpresso通用功能
- :
- Re: MCUXpresso IDE crashes when debug started
MCUXpresso IDE crashes when debug started
MCUXpresso IDE crashes when debug started
Hi Bruce,
We’re actively investigating the “Interrupt failed.” error dialog. It seems to occur intermittently, and the eclipse IDE disables focus on the run control “Continue” and “Pause” controls. The MCU can be left in either debug halt or execution mode.
I recommend you debug in All-Stop mode for the time being. It seems to occur less frequently in All-Stop. You can also set an additional break in code you know is in the thread of execution (to halt), or manually start/stop MCU execution using the “CMRUN this” or “CMHALT this” commands respectively from the RedlinkServer console when this problem manifests.
Sorry for the inconvenience.
Thanks and regards,
MCUXpresso Support
Hi Bruce,
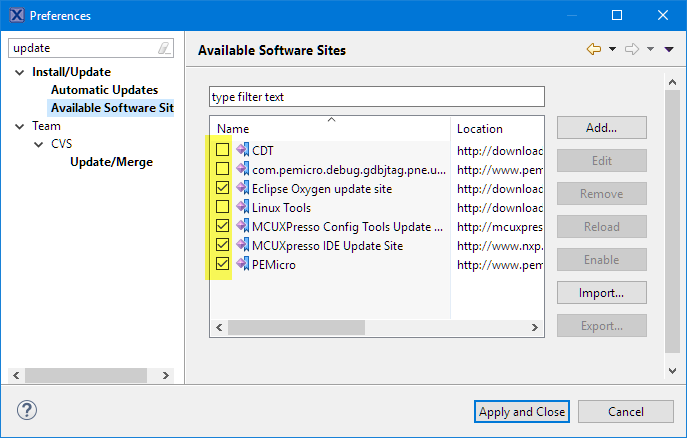
the last message in the .log points to the eclipse equinox updater failing (somehow).
I would disable all update sites here to see if this has an effect:
I hope this helps,
Erich
Does it happen only for a specific debug/launch configuration?
Or does it happen with the provided examples in the SDK too?
Just trying to find out if this is related to the project you have or maybe related to the installation of your IDE.
The problem is occurring randomly on the two PCs we use for development.
My PC is running Windows 7. The other PC is running Windows 10.
The problem occurs with new projects and old projects.
It usually happens when a customer or my boss or a co-worker is looking over my shoulder and I try to assure them that we have great development tools.
I did not find a log file. Do I need to do something to enable the log file?
Hi Bruce,
there are the GDB logs and trace messages, see Board Bring-Up Tips, GDB Logs and Traces in Eclipse | MCU on Eclipse
Basically it is a log of what messages are sent to the GDB debugger. Not sure if this will show anything in your case, but might be helpful if there are messages logged.
Erich
The gdb traces Console window is empty. When MCUXpresso is successful, the gdb traces window shows the j-link parameters.
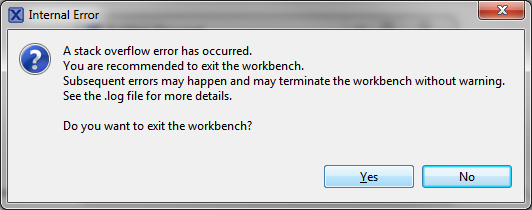
When the error occurs, I can't find the log file that the "Internal Error" dialog refers to.
It appears that MCUXpresso failed before attempting to connect to my j-link.
Is there something I can setup in Java that might help sort out were the problem is?
Hi Bruce,
I'm running out of ideas. Have you tried with something different than the J-Link connection?
Erich
It looks like j-link is not involved.
The Java error is occurring when I click the debug button, and before MCUXpresso connects to the j-link.
Can I setup a Java debugger to trap the error in MCUXpresso?
Hi Bruce:
I would suggest you try with the latest MCUXpresso IDE v10.3.
Regards
Daniel
I installed
MCUXpresso IDE v11.0.0 [Build 2516] [2019-06-05]
The automatic updates are disabled.
SEGGER J-Link GDB Server V6.44i
!!!!!!!!!!!!!!!!!!!!!!!!!!!!!!! The @#$%!@#$ debugger crashes every other time I run it !!!!!!!!!!!!!!!!!!!!!!!!!!!!!!!
When the debugger runs for a few minutes, the MCU halts, and when I halt the debugger, I get a pop dialog:
Title: Error
Message: Interrupt failed.
What is going on?
This is really pissing me off, so any suggestions, please.
Thanks,
Bruce
I had that message with bad debug cable connection (the cable had broken wires, causing all kind of weird issues).
I recommend you are swapping out your debug probe/cables to check if this is the same for you.
Erich
Different PCs, boards, j-links, cables, etc. Same exact problems.
Start debug, debug, restart debug, MCUXpresso stack fault.
Or, MCUXpresso halts, MCUXpresso Interrupt failed.
How do I figure out what is wrong, not with my hardware, but with MCUXpresso?
Thanks,
Bruce
When MCUXpresso starts the debug session, the Debug Console spits out:
[New Thread 536873488]
[New Thread 536867504]
[New Thread 536871696]
[New Thread 536869056]
[New Thread 536874344]
[New Thread 536870048]
[Switching to Thread 536872992]
When MCUXpresso losses connection to the mcu, the Debug Console spits out:
[New Thread 1]
[Switching to Thread 536869056]
My code is not creating a new thread 1, so what is this telling me?
Thanks,
Bruce

