- Forums
- Product Forums
- General Purpose MicrocontrollersGeneral Purpose Microcontrollers
- i.MX Forumsi.MX Forums
- QorIQ Processing PlatformsQorIQ Processing Platforms
- Identification and SecurityIdentification and Security
- Power ManagementPower Management
- Wireless ConnectivityWireless Connectivity
- RFID / NFCRFID / NFC
- Advanced AnalogAdvanced Analog
- MCX Microcontrollers
- S32G
- S32K
- S32V
- MPC5xxx
- Other NXP Products
- S12 / MagniV Microcontrollers
- Powertrain and Electrification Analog Drivers
- Sensors
- Vybrid Processors
- Digital Signal Controllers
- 8-bit Microcontrollers
- ColdFire/68K Microcontrollers and Processors
- PowerQUICC Processors
- OSBDM and TBDML
- S32M
- S32Z/E
-
- Solution Forums
- Software Forums
- MCUXpresso Software and ToolsMCUXpresso Software and Tools
- CodeWarriorCodeWarrior
- MQX Software SolutionsMQX Software Solutions
- Model-Based Design Toolbox (MBDT)Model-Based Design Toolbox (MBDT)
- FreeMASTER
- eIQ Machine Learning Software
- Embedded Software and Tools Clinic
- S32 SDK
- S32 Design Studio
- GUI Guider
- Zephyr Project
- Voice Technology
- Application Software Packs
- Secure Provisioning SDK (SPSDK)
- Processor Expert Software
- Generative AI & LLMs
-
- Topics
- Mobile Robotics - Drones and RoversMobile Robotics - Drones and Rovers
- NXP Training ContentNXP Training Content
- University ProgramsUniversity Programs
- Rapid IoT
- NXP Designs
- SafeAssure-Community
- OSS Security & Maintenance
- Using Our Community
-
- Cloud Lab Forums
-
- Knowledge Bases
- ARM Microcontrollers
- i.MX Processors
- Identification and Security
- Model-Based Design Toolbox (MBDT)
- QorIQ Processing Platforms
- S32 Automotive Processing Platform
- Wireless Connectivity
- CodeWarrior
- MCUXpresso Suite of Software and Tools
- MQX Software Solutions
- RFID / NFC
- Advanced Analog
-
- NXP Tech Blogs
- Home
- :
- Software Forums
- :
- S32 Design Studio
- :
- Eternal "configuring GDB" if P&E Multilink not connected or target OFF
Eternal "configuring GDB" if P&E Multilink not connected or target OFF
- Subscribe to RSS Feed
- Mark Topic as New
- Mark Topic as Read
- Float this Topic for Current User
- Bookmark
- Subscribe
- Mute
- Printer Friendly Page
Eternal "configuring GDB" if P&E Multilink not connected or target OFF
- Mark as New
- Bookmark
- Subscribe
- Mute
- Subscribe to RSS Feed
- Permalink
- Report Inappropriate Content
Hello
Our team is developing on MPC5744P using the MC33908 eval board and a MPC5744P daughter board, as well as a P&E Multilink Universal cable for downloading and debugging. The IDE used is S32 for Power 1.0.
When pressing the "Debug" button, there are cases where the target can be forgotten to turn on, or the Multilink cable be disconnected, or in use under another program (the P&E Nexus Programmer for bare downloading).
In those cases (which are mere and common "mistakes") result in the debugging process getting stuck in "Configuring GDB...". Pressing the STOP button next to it shows "Cancel Request" next to that message, but the "Configuring GDB..." is never cancelled.
Then, the only option is to close and re-open S32. And if you dare starting another debugging session without doing that, the P&E Multilink fails to respond (it is neither detected by S32 in the "Debugger" Tab under Project Properties/Run&Debug" nor by the P&E Nexus Programmer) until the computer is rebooted.
- Is there any more comfortable workaround (either official or based on your experience) on this embarrassing issue (which may happen to anybody)?
Thank you.
- Mark as New
- Bookmark
- Subscribe
- Mute
- Subscribe to RSS Feed
- Permalink
- Report Inappropriate Content
Hello,
Thanks for this report!
I'm able to reproduce this issue on my side. It occurs sort of randomly and I haven't found a exact reproducible instructions yet.
Anyway, we are aware of this stability issue (logged in our defect database under ENGR00372722) and we'd like to improve the stability in the next release.
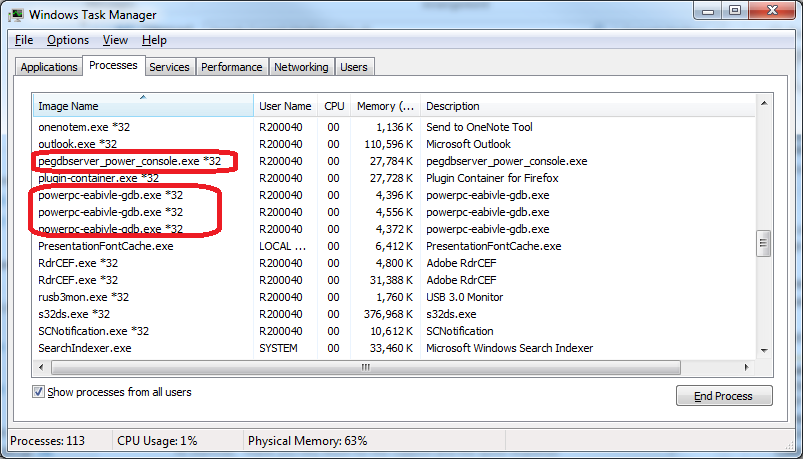
I'd recommend you to "kill" the GDB process(es) directly in the task manager as a workaround. This way you don't have to restart S32DS.
Hope it helps,
Regards,
Stan
- Mark as New
- Bookmark
- Subscribe
- Mute
- Subscribe to RSS Feed
- Permalink
- Report Inappropriate Content
Hi
I couldn't find these processes in windows 10 system?
Thanks.
- Mark as New
- Bookmark
- Subscribe
- Mute
- Subscribe to RSS Feed
- Permalink
- Report Inappropriate Content
Hi,
these processes run only, if you have active any debug session.
Regards,
Martin
