- Forums
- Product Forums
- General Purpose MicrocontrollersGeneral Purpose Microcontrollers
- i.MX Forumsi.MX Forums
- QorIQ Processing PlatformsQorIQ Processing Platforms
- Identification and SecurityIdentification and Security
- Power ManagementPower Management
- MCX Microcontrollers
- S32G
- S32K
- S32V
- MPC5xxx
- Other NXP Products
- Wireless Connectivity
- S12 / MagniV Microcontrollers
- Powertrain and Electrification Analog Drivers
- Sensors
- Vybrid Processors
- Digital Signal Controllers
- 8-bit Microcontrollers
- ColdFire/68K Microcontrollers and Processors
- PowerQUICC Processors
- OSBDM and TBDML
- S32M
-
- Solution Forums
- Software Forums
- MCUXpresso Software and ToolsMCUXpresso Software and Tools
- CodeWarriorCodeWarrior
- MQX Software SolutionsMQX Software Solutions
- Model-Based Design Toolbox (MBDT)Model-Based Design Toolbox (MBDT)
- FreeMASTER
- eIQ Machine Learning Software
- Embedded Software and Tools Clinic
- S32 SDK
- S32 Design Studio
- GUI Guider
- Zephyr Project
- Voice Technology
- Application Software Packs
- Secure Provisioning SDK (SPSDK)
- Processor Expert Software
- MCUXpresso Training Hub
-
- Topics
- Mobile Robotics - Drones and RoversMobile Robotics - Drones and Rovers
- NXP Training ContentNXP Training Content
- University ProgramsUniversity Programs
- Rapid IoT
- NXP Designs
- SafeAssure-Community
- OSS Security & Maintenance
- Using Our Community
-
- Cloud Lab Forums
-
- Knowledge Bases
- ARM Microcontrollers
- i.MX Processors
- Identification and Security
- Model-Based Design Toolbox (MBDT)
- QorIQ Processing Platforms
- S32 Automotive Processing Platform
- Wireless Connectivity
- CodeWarrior
- MCUXpresso Suite of Software and Tools
- MQX Software Solutions
-
- Home
- :
- MCUXpresso软件和工具
- :
- MCUXpresso IDE
- :
- Re: FreeRTOS gdb plugin seems to slow down as the number of active tasks/threads increases...?
FreeRTOS gdb plugin seems to slow down as the number of active tasks/threads increases...?
FreeRTOS gdb plugin seems to slow down as the number of active tasks/threads increases...?
Hi everyone,
As our development has got bigger over time, our ability to debug it inside MCUXpresso / gdb has progressively worsened. We're now seeing a delay of around 30 seconds between hitting a breakpoint and the debugger returning control to us, which is... not exactly ideal.
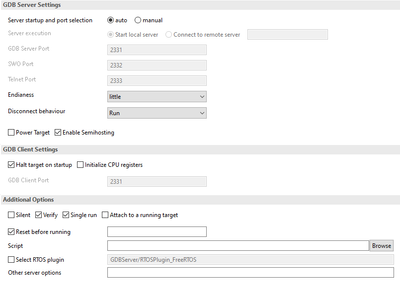
After (many) experiments, we discovered that the problem disappears if we untick the "Select RTOS plugin" (in the launch configuration's JLink Debugger tab), so it seems to be to do with that.
Furthermore, there is no slowdown near the start of main(), but the responsiveness gets progressively worse the more tasks get launched (20 threads is typical for our devices). Hence it seems likely to us to be a slowdown issue (a) caused by the FreeRTOS plugin, and (b) to do with the number of active tasks.
Our FreeRTOS plugin seems to be configured correctly (e.g. uxTopUsedPriority and FreeRTOSDebugConfig both have valid addresses, etc), and there are no error messages visible in the JLinkServer console window, so everything seems to be working correctly. (Correctly, that is, apart from the 30+ second silent pause when you hit a breakpoint in normal running.)
Is this a known issue? Is there a workaround?
Thanks, Nick
PS: our modules are based on the i.MX RT1064
Update: I've had some feedback from developers on the gdb dev ticket I raised, and have done even more gdb trace debugging. From that, it now seems that the issue is not caused by buggy gdb behaviour, but rather by buggy behaviour by gcc (both compiler and linker).
For example, if I use arm-none-eabi-readelf --debug-dump=macro xxxx.axf, I get more than 16000 instances that look like this (and this is true from mcuxpresso 11.1.0 all the way to 11.6.1):
DW_MACRO_start_file - lineno: 16 filenum: 3 filename: c:\nxp\mcuxpressoide_11.1.0_3209\ide\tools\lib\gcc\arm-none-eabi\8.3.1\include/stddef.h
DW_MACRO_import - offset : 0x0
DW_MACRO_end_file
It appears that the gcc compiler emits malformed DWARF tokens for macros (i.e. where a DW_MACRO_import token has an offset of 0x0), which is then preserved by the gnu linker, causing a number of follow-on issues within gdb. Gcc developers have already looked at this issue:
https://gcc.gnu.org/bugzilla/show_bug.cgi?id=91239
A related fix (by H.J.Lu) from March 2021 may (or may not, it's hard for me to tell) fix this issue:
https://sourceware.org/bugzilla/show_bug.cgi?id=27590
Does NXP have a more recent release of gcc cross-compiler tools I could try here to see if it fixes this gdb slowdown issue? If it does, this would be good to include in a 11.6.2 release (hint).
Thanks, Nick
I have the same problem, 37s from when the interrupt occurs to when the screen is refreshed.
Project for imx1062 with heap4 and 17 tasks.
MCUX expressed in 11.6.1 and SDK 2.12.1
I tried with 2 JTAGs the Jlink Ultra + and the PE multilink FX and they are similar.
Are you linking with the --gc-sections linker option enabled? I'm wondering whether what's happening is that when the gcc linker garbage collects unused sections, it's still retaining all the gcc compiler references to symbols in removed sections but setting them all to 0x0, which is what is annoying gdb so much.
Unfortunately I can't test this here because removing --gc-sections adds 250K to my executable, pushing it beyond the fixed size I am able to run. But while we're all waiting for a compiler / linker / gdb fix, this workaround might work for you. Please let me know if you try it!
Cheers, Nick
Hi @robertomorsiani ,
I've been tracing this issue through gdb (with gdb trace debug flags), and it seems to me that the delay happens inside gdb immediately after parsing the DWARF data associated with a given thread.
I've raised a ticket on the gdb bug tracker describing what I'm seeing, and I'm optimistic that someone there will be able to shed at least a little light on what's going on (from a gdb point of view).
However, there's also a chance that the root cause of the issue is something deep in how the gcc tools are writing out the DWARF data. So even gdb might not be the real problem here.
Cheers, Nick
PS: imagine how I feel when I'm debugging with 30 threads! Not super-happy, that's for sure.
I've had some follow-on correspondence with Arne at Segger, to whom I sent through a full JLinkServer log (enable this with "-log filename.log" in the "Other server options" section of the JLinkServer tab).
According to Arne, the gdb client is sending a "g" (read general registers) request, which the JLink Server layer is responding to within a couple of milliseconds. There is then a pause of about 5 seconds before the next gdb client request (an "m" request, to read memory).
So it seems that the long delays here are in fact on the GDB client side, and not on the GDB server side. I therefore suspect that something in the "g" response is triggering an issue on the client side.
Can anyone tell me where I can find the source for the code on the GDB client side? @ErichStyger ?
Or how I can enable even more debug output from gdb itself?
Arne's comments:
I can see some delays of about 5 seconds sometimes after the GDB client gets the result of the "read general registers" query. The result is delivered within a few milliseconds:
00-000004D4-00-00035348-0005: $g#67
03-00000000-00-00035348-0016: Reading all registers
02-00000000-00-00035348-0043: T4EC4 035:349.817 JLINK_ReadMemU32(0x2002D610, 0x0001 Items, ...)
02-00000000-00-00035349-0040: T4EC4 035:349.894 -- Read from C cache (4 bytes @ 0x2002D610)
02-00000000-00-00035349-0026: T4EC4 035:349.933 Data: C4 D5 02 20
02-00000000-00-00035349-0025: T4EC4 035:349.971 - 0.155ms returns 1
02-00000000-00-00035349-003F: T4EC4 035:350.012 JLINK_ReadMem (0x2002D5C4, 0x0044 Bytes, ...)
02-00000000-00-00035349-003A: T4EC4 035:350.055 -- CPU_ReadMem(64 bytes @ 0x2002D5C0)
02-00000000-00-00035350-0040: T4EC4 035:350.878 -- Updating C cache (64 bytes @ 0x2002D5C0)
02-00000000-00-00035350-0041: T4EC4 035:350.923 -- Read from C cache (68 bytes @ 0x2002D5C4)
02-00000000-00-00035350-004E: T4EC4 035:350.952 Data: A5 A5 A5 A5 A5 A5 A5 A5 A5 A5 A5 A5 A5 A5 A5 A5 ...
02-00000000-00-00035350-0028: T4EC4 035:350.979 - 0.968ms returns 0x00
01-000004D4-00-00035350-008C: $00000000a5a5a5a5a5a5a5a5a5a5a5a5a5a5a5a5a5a5a5a5a5a5a5a5a5a5a5a5a5a5a5a5a5a5a5a5a5a5a5a5a5a5a5a5a5a5a5a508d60220814709600025000000000001#11
02-00000000-00-00035752-0028: T356C 035:752.899 JLINK_GetHWStatus(...)
02-00000000-00-00035752-0028: T356C 035:753.230 - 0.334ms returns 0x00
02-00000000-00-00037961-0028: T356C 037:961.912 JLINK_GetHWStatus(...)
02-00000000-00-00037961-0028: T356C 037:962.251 - 0.344ms returns 0x00
02-00000000-00-00040172-0028: T356C 040:172.897 JLINK_GetHWStatus(...)
02-00000000-00-00040172-0028: T356C 040:173.182 - 0.287ms returns 0x00
00-000004D4-00-00040573-000B: $m2500,4#94
The bold lines are:
- Query "g" (read general registers) from the GDB client
- Reply from the GDB server
- Query "m" (read memory) from the GDB client
I don't know why there is a delay, but it looks like this is not caused by the GDB server.
Hi @np ,
You have to distinguish between the GDB thread awareness (Debug view):
Clearly, the more tasks you have, the more data the debugger has to read from the target. With a J-Link this takes maybe around 1 second for 10 tasks. The target stops, the debugger needs to go through the list of tasks and then perform the stack back-trace.
And there are the other views from NXP, like the task list:
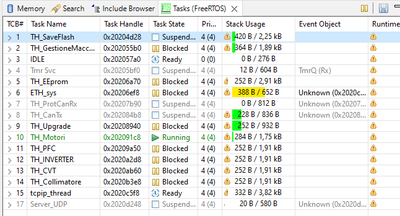
They are even more intrusive, because they need to read a lot of more data and traverse extra data structures. So I recommend to use these views only if needed, put them into the background so they are not visible, or use the 'pause' button.
How much data is read you can verify using the GDB traces, see an article I wrote a while back on this: https://mcuoneclipse.com/2016/07/01/board-bring-up-tips-gdb-logs-and-traces-in-eclipse/
Last but not least, I would question why you have your system designed with 20 tasks. Sure, this depends on the application, but imho having more than 10 tasks is rarely justified. You have to keep in mind that the more tasks you have, you inherently can affect the RTOS performance, because it needs to traverse the internal lists. Just some thoughts.
I hope this helps,
Erich
Hi Erich,
Thank you very much for your reply! It made me look more closely at the gdb debugger trace output. The timestamps (at the left) make it easy to see exactly when the problem is happening:
067,205 ~"Thread 3 hit Breakpoint 1, main (argc=0, argv=0x0) at ../src/main.c:1474\n"
067,207 ~"1474\t HOSTPLATFORM_TasksHaveStarted();\n"
067,207 *stopped,reason="breakpoint-hit",disp="keep",bkptno="1",frame={addr="0x60053872",func="main"\
,args=[{name="argc",value="0"},{name="argv",value="0x0"}],file="../src/main.c",fullname="C:\\[CompanyName]\
\\repos\\platformmaster\\Platform_FreeRTOS\\src\\main.c",line="1474",arch="armv7e-m"},thread-id="3",\
stopped-threads="all"
067,207 (gdb)
067,207 46^error,msg="Thread ID 2 not known."
067,207 (gdb)
067,214 47-list-thread-groups i1
067,214 48-data-list-register-values --thread 3 --frame 0 x 25
067,227 49-list-thread-groups
094,857 47^done,threads=[{id="3",target-id="Thread 539471488",details="ac_voltage_monitor : Running \
[P: 17]",frame={level="0",addr="0x60053872",func="main",args=[{name="argc",value="0"},{name="argv",v\
alue="0x0"}],file="../src/main.c",fullname="C:\\[CompanyName]\\repos\\platformmaster\\Platform_FreeRTOS\\s\
rc\\main.c",line="1474",arch="armv7e-m"},state="stopped"},{id="4",target-id="Thread 539330416",detai\
ls="healthmon_eq_task [P: 1]",frame={level="0",addr="0x600dad1c",func="PLATFORMLIB_HealthMon_EEPROM_\
(etc)
From the above, it seems that gdb request #47 "list-thread-group i1" is taking 27.643 seconds to complete. I've gone through each line of the full response separately, and all of the entries seem well-formed, i.e. no unexpected values or unterminated strings etc.
I've also looked on the JLinkServer console tab, and there's no unexpected traffic there either. You further asked about the FreeRTOS windows (Task List, etc), I have none of these open at all.
The issue here therefore seems to be much as I guessed, i.e. something going wrong inside the FreeRTOS GDBServer plugin code where it iterates through the thread list. My guess now is that the issue will turn out to be a buffer overflow, a sscanf() misuse, or a fixed-size array (i.e. where the number of entries is too small).
Do you know where the source code of the FreeRTOS GDBServer plugin is?
Thanks, Nick
PS: we have 15 tasks active on this device, which I don't think is an unreasonable number for a modern threaded system. A decade ago, I too would have thought 10 should be plenty, but things have moved on.
According to GDB traces, request #47 (-list-thread-groups, an MI command) made by the IDE through the GDB client gets back the result in ~27 seconds. The GDB server will try to walk the FreeRTOS internal data structures to identify all the tasks, identify currently executing task, associate IDs (TCB address), obtain tasks states, read tasks names, unstack saved registers for each task, read tasks priorities + any other information required by the J-Link GDB server. There's a lot of data read from target.
It would also be interesting to test the same use case with a LinkServer debug session or with PEmicro. Unfortunately, we do not have access to J-Link's FreeRTOS GDB server plugin code either. If you see the same behavior with LinkServer, some sort of reproducibility instructions would be helpful in order to attempt any performance improvement.
Regards,
MCUXpresso IDE Support
I shared a complete JLinkServer debug session with Arne in Segger support: Arne's conclusion (which I pasted elsewhere on this page) was that there was no evidence of a GDB server-side delay.
By way of support, Arne pointed out (in the quoted section of the log) that there was a five second client-side delay between the response back from a "g" (read general registers) request and the start of the next gdb client request (an "m" request, to read memory).
This would seem to imply that the delay we're seeing is actually inside MCUXpresso's GDB client code, i.e. where MCUXpresso is (for some reason) taking a long time between successive calls to gdb. Perhaps there is something in the contents of the "g" response that is out of some expected range?
Can you please tell me if the gdb client code in MCUXpresso (i.e. that makes the calls to gdb) is publicly available? Or, if not, can you please tell me if there are any additional debug logging flags I can enable when I launch MCUXpresso that would provide more detail about what MCUXpresso's gdb client code is doing? Thanks!
GDB code is open source - https://sourceware.org/git/?p=binutils-gdb.git;a=tree;h=refs/heads/master;hb=refs/heads/master
If you're using MCUXpresso IDE v11.6.x, you'll need to inspect GDB 10.x branch. But, in my opinion, you'll reach a dead end. It's not an easy task to build and then debug GDB (with GDB itself or Visual Studio).
I tend to believe that the slowness comes from the GDB server. I did not see in Arne's answer any reference to the data I mentioned in my previous post. Obviously, a lot more data is read from target than general purpose registers and memory around program counter for stack crawling. Otherwise we wouldn't talk about any GDB "thread awareness" but "bare-metal debug session". From my experience with the RTOS awareness plugins for J-Link, all plugins are trying to read and cache as much data as it can when target gets first suspended. Then several RSP requests are "served" with data already read. If you're involved in an active discussion with Arne, I'd clarify how long does it take on the server side to read all tasks-specific data.
You can also inspect the RSP protocol log by enabling specific logging (i.e. "set debug remote 1"). See https://sourceware.org/gdb/onlinedocs/gdb/Debugging-Output.html for more debugging options.
Regards,
MCUXpresso IDE Support
Having looked through the gdb source code (particularly frame_unwind_find_by_frame()), I had a hunch that the DWARF loading might be somehow involved, and so enabled gdb's DWARF debug (which I hadn't done before), and it indeed looks as though this is where the real issue is. The gdb flags I used were:
set debug remote 1
set debug target 1
set debug frame 10
set debug infrun 1
set debug dwarf-read 10
set debug dwarf-line 10
The gdb log starts with the familiar "target_fetch_registers" stuff:
568,939 &"target_fetch_registers (pc) = 00250000 0x2500 9472\n"
568,939 &"-> register=15 bytes=[00250000] }\n"
568,939 &"{ frame_unwind_pc (this_frame=-1) -> 0x2500 }\n"
However, it then immediately continues with DWARF-related activities, where the debugger is expanding the symbol tables:
568,940 &"Expanding one or more symtabs of objfile C:\\[Company Name]\\repos\\platformmaster\\Platform_Free\
RTOS\\Debug\\Platform_FreeRTOS.axf ...\n"
568,940 &"Expanding symtab of CU at offset 0x8f351\n"
After a shedload of directories (21) and files (127) and lines (484!) get imported and processed, execution then inexplicably pauses for 5 seconds just before finishing:
568,950 &"Recording line 0, file enet_async_message.c, address 0x60061014\n"
573,910 &"Done expanding CU at offset 0x8f351\n"
573,910 &"Done expanding symtabs of C:\\[Company Name]\\repos\\platformmaster\\Platform_FreeRTOS\\Debug\\Pl\
atform_FreeRTOS.axf.\n"
573,910 &"-> remote->get_unwinder (...)\n"
573,910 &"<- remote->get_unwinder () = 0x0\n"
This looks to be exactly where the slowdown is happening, I think. Might it be nothing more complex than a colossal JVM garbage collection?
Thank you very much for that, your reply was very helpful!
Enabling "set debug remote 1" shows basically the same client log as the JLinkServer server side log, e.g. you can see the "g" request's response coming back after a millisecond but the next "m" request going out 5+ seconds later:
217,454 &"Sending packet: $g#67..."
217,455 &"Packet received: 00000000a5a5a5a5a5a5a5a5a5a5a5a5a5a5a5a5a5a5a5a5a5a5a5a5a5a5a5a5a5a5a5a5a\
5a5a5a5a5a5a5a5a5a5a5a5a5a5a5a59882032081470960223a0e6000000001\n"
223,035 &"Sending packet: $m600e3a22,4#c0..."
And so I enabled more gdb debugging flags ("set debug target 1", and "set debug symbol-lookup 1") to see if I could see what was happening between the two:
609,277 &"Sending packet: $g#67..."
609,279 &"Packet received: 00000000a5a5a5a5a5a5a5a5a5a5a5a5a5a5a5a5a5a5a5a5a5a5a5a5a5a5a5a5a5a5a5a5a\
5a5a5a5a5a5a5a5a5a5a5a5a5a5a5a5683f032081470960d482000000000001\n"
609,279 &"<- remote->fetch_registers (0xdc06400, 15)\n"
609,279 &"target_fetch_registers (pc) = d4820000 0x82d4 33492\n"
614,963 &"-> remote->get_unwinder (...)\n"
614,963 &"<- remote->get_unwinder () = 0x0\n"
614,963 &"-> remote->get_tailcall_unwinder (...)\n"
614,963 &"<- remote->get_tailcall_unwinder () = 0x0\n"
614,963 &"-> remote->xfer_partial (...)\n"
614,963 &"-> remote->always_non_stop_p (...)\n"
614,963 &"<- remote->always_non_stop_p () = false\n"
614,963 &"-> remote->is_async_p (...)\n"
614,963 &"<- remote->is_async_p () = false\n"
614,963 &"Sending packet: $m82d4,4#cf..."
In fact, all the delays seem to be happening after calls to target_fetch_registers. In seconds:
0, 0, 1.4, 0, 0, 0, 0, 1.4, 0, 5.6, 0, 0, 5, 0, 5, 5
I'm guessing that this maps directly onto the number of threads being retrieved, so it looks as though the behaviour starts when you have 10 threads, and then gets worse on threads 13, 15, 16 etc.
I then turned on pretty much all the gdb debugging flags, and got this:
667,210 &"Sending packet: $g#67..."
667,212 &"Packet received: 00000000a5a5a5a5a5a5a5a5a5a5a5a5a5a5a5a5a5a5a5a5a5a5a5a5a5a5a5a5a5a5a5a5a\
5a5a5a5a5a5a5a5a5a5a5a5a5a5a5a558b10220814709607c73000000000001\n"
667,212 &"<- remote->fetch_registers (0xbc631c8, 15)\n"
667,212 &"target_fetch_registers (pc) = 7c730000 0x737c 29564\n"
667,212 &"-> register=15 bytes=[7c730000] }\n"
667,212 &"{ frame_unwind_pc (this_frame=-1) -> 0x737c }\n"
672,756 &"-> remote->get_unwinder (...)\n"
672,756 &"<- remote->get_unwinder () = 0x0\n"
So, the delay seems to be happening between frame_unwind_pc() and remote->get_unwinder(). Which I suspect may be as much debugging info as I can get.
Do stack frames look OK on tasks 13, 15, 16? Maybe the stack unwinding algorithm goes sideways for some reason...
Regards,
MCUXpresso IDE Support
I do have about 10 tasks in my system, and I don't see such a delay.
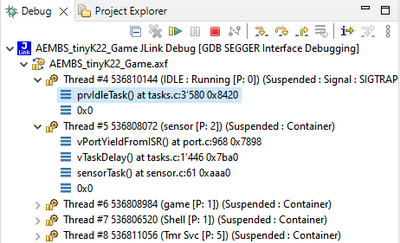
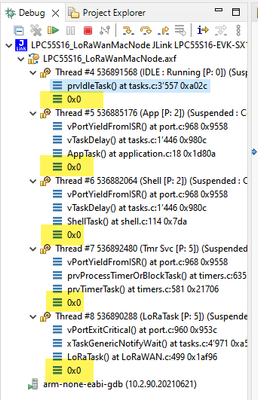
Just one thing: have you terminated the task stack frames with a zero value as shown below? Because this makes the stack crawl faster and terminates the search. Maybe it is just this?
Erich


