- Forums
- Product Forums
- General Purpose MicrocontrollersGeneral Purpose Microcontrollers
- i.MX Forumsi.MX Forums
- QorIQ Processing PlatformsQorIQ Processing Platforms
- Identification and SecurityIdentification and Security
- Power ManagementPower Management
- MCX Microcontrollers
- S32G
- S32K
- S32V
- MPC5xxx
- Other NXP Products
- Wireless Connectivity
- S12 / MagniV Microcontrollers
- Powertrain and Electrification Analog Drivers
- Sensors
- Vybrid Processors
- Digital Signal Controllers
- 8-bit Microcontrollers
- ColdFire/68K Microcontrollers and Processors
- PowerQUICC Processors
- OSBDM and TBDML
- S32M
-
- Solution Forums
- Software Forums
- MCUXpresso Software and ToolsMCUXpresso Software and Tools
- CodeWarriorCodeWarrior
- MQX Software SolutionsMQX Software Solutions
- Model-Based Design Toolbox (MBDT)Model-Based Design Toolbox (MBDT)
- FreeMASTER
- eIQ Machine Learning Software
- Embedded Software and Tools Clinic
- S32 SDK
- S32 Design Studio
- GUI Guider
- Zephyr Project
- Voice Technology
- Application Software Packs
- Secure Provisioning SDK (SPSDK)
- Processor Expert Software
- MCUXpresso Training Hub
-
- Topics
- Mobile Robotics - Drones and RoversMobile Robotics - Drones and Rovers
- NXP Training ContentNXP Training Content
- University ProgramsUniversity Programs
- Rapid IoT
- NXP Designs
- SafeAssure-Community
- OSS Security & Maintenance
- Using Our Community
-
- Cloud Lab Forums
-
- Knowledge Bases
- ARM Microcontrollers
- i.MX Processors
- Identification and Security
- Model-Based Design Toolbox (MBDT)
- QorIQ Processing Platforms
- S32 Automotive Processing Platform
- Wireless Connectivity
- CodeWarrior
- MCUXpresso Suite of Software and Tools
- MQX Software Solutions
-
- Home
- :
- MCUXpressoソフトウェアとツール
- :
- MCUXpresso IDE
- :
- Re: Can not launch the debugger on MCUXpresso 11.1.1
Can not launch the debugger on MCUXpresso 11.1.1
- RSS フィードを購読する
- トピックを新着としてマーク
- トピックを既読としてマーク
- このトピックを現在のユーザーにフロートします
- ブックマーク
- 購読
- ミュート
- 印刷用ページ
Can not launch the debugger on MCUXpresso 11.1.1
- 新着としてマーク
- ブックマーク
- 購読
- ミュート
- RSS フィードを購読する
- ハイライト
- 印刷
- 不適切なコンテンツを報告
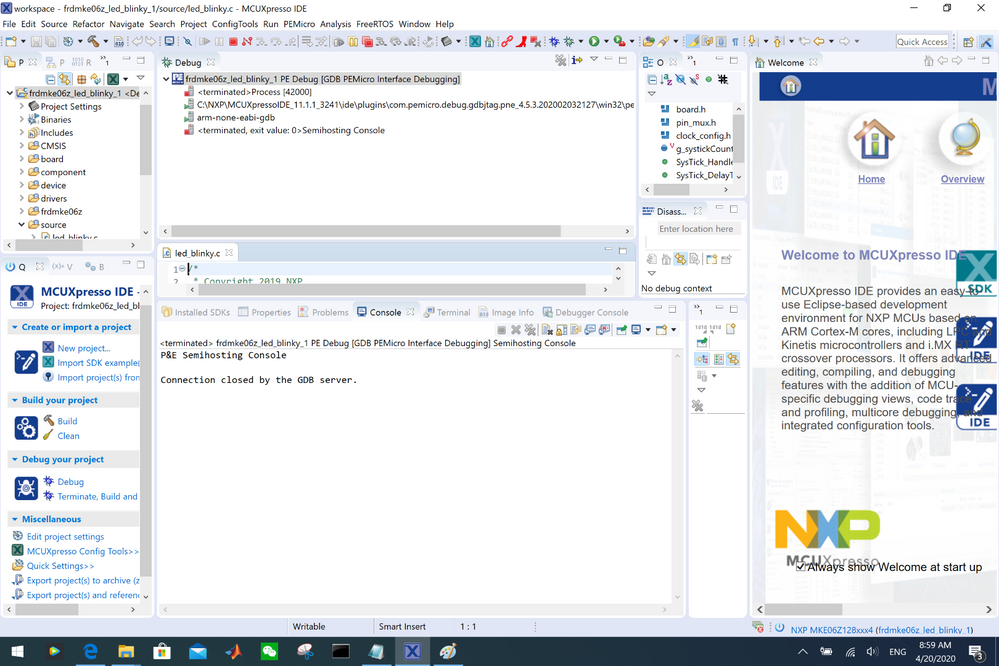
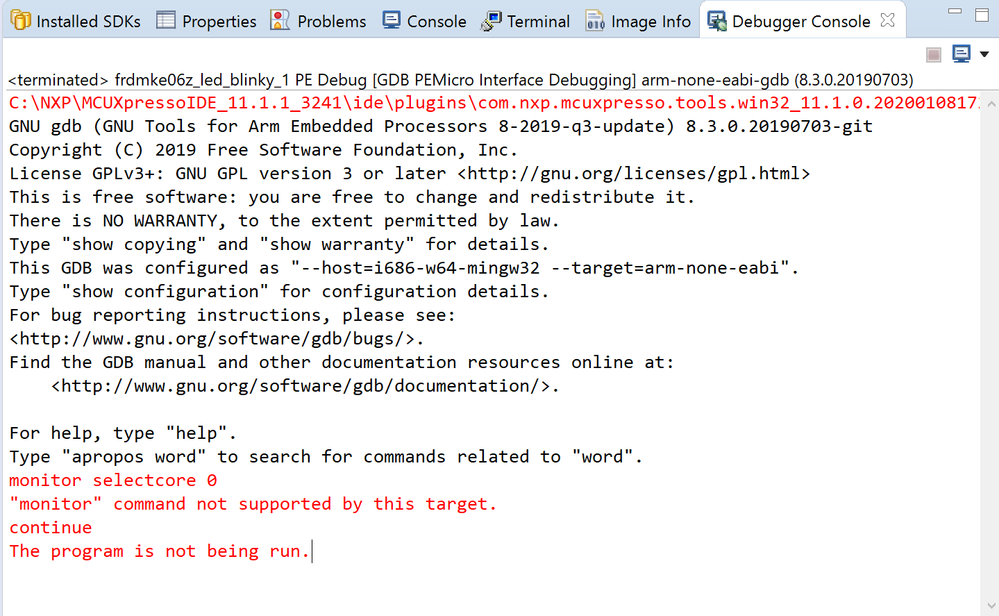
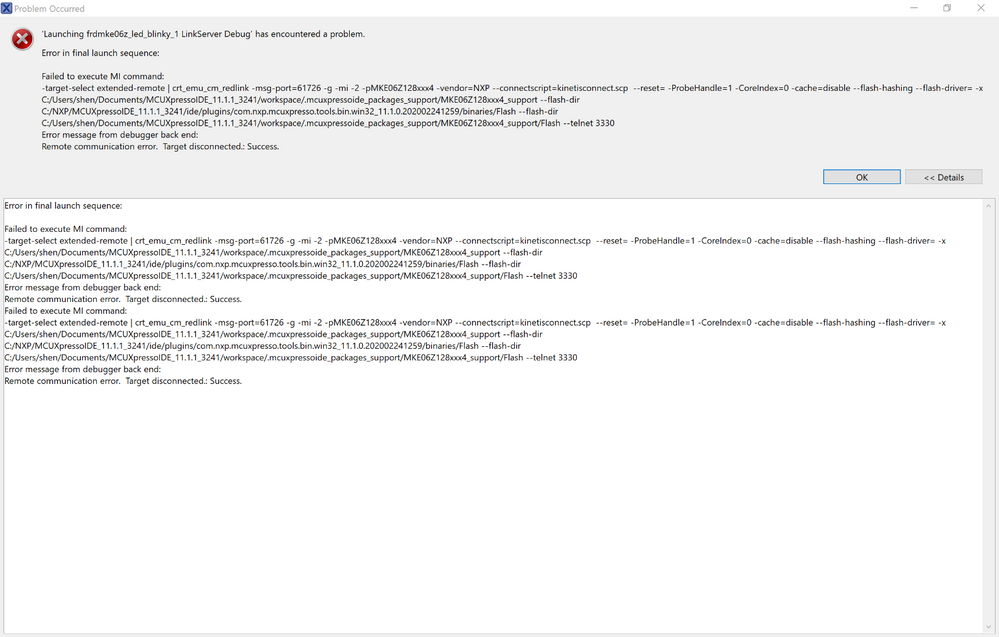
I just install the latest MCUXpresso IDE (MCUXpresso IDE v11.1.1 [Build 3241] [2020-03-02]) on my 64bits win10 surface pro 4. And importing a SDK sample for FRDM-KE06Z board, then make it is OK, but when I debug it I got the problem as picture show. And for check the hardware problem, I used KDS ( installed the same computer) to make a sample for same board, it is OK for the debug. Could you advise me how to fix this problem? Thanks.
- 新着としてマーク
- ブックマーク
- 購読
- ミュート
- RSS フィードを購読する
- ハイライト
- 印刷
- 不適切なコンテンツを報告
Hellozhongshen,
Just to confirm,
If you update the FRDM-KE06Z debugger firmware from OpenSDA Serial and Debug Adapter | NXP (download PE or CMSIS-DAP or segger) and then debug on a new project for the KE06 the same issue keeps appearing ?
Regards, Diego
- 新着としてマーク
- ブックマーク
- 購読
- ミュート
- RSS フィードを購読する
- ハイライト
- 印刷
- 不適切なコンテンツを報告
Hi Diego,
Thanks for your help.
I try to use these three firmware, "P&E Micro v118", "CMSIS-Segger Jlink V1" and "DAP Debug Application for OpenSDAv1".
Here is the result. PE Micro V118 has the same problem as above; OpenSDAv1 ( download from https://www.nxp.com/assets/downloads/data/en/reference-applications/CMSIS-DAP-OpenSDA.zip ) only has about 32KB size of CMSIS-DAP_OpenSDA.S19, I am not should that is the correct firmware which has the problem MCUXpresso IDE both of win10 and linux platform( see the following pics ). The Jlink V1 ( download from https://www.segger.com/downloads/jlink/OpenSDA_FRDM-KE06Z ) is worked OK on MCUXpresso IDE.
Console information:
MCUXpresso IDE RedlinkMulti Driver v11.1 (Feb 24 2020 13:54:38 - crt_emu_cm_redlink build 11)
Found part description in XML file MKE06Z4_internal.xml
Reconnected to existing LinkServer process.
============= SCRIPT: kinetisconnect.scp =============
Kinetis Connect Script
Connecting to Probe Index = 1
This probe = 1
This TAP = 0
This core = 0
DpID = 0BC11477
Assert NRESET
Reset pin state: 00
Power up Debug
MDM-AP APID: 0x001C0020
MDM-AP System Reset/Hold Reset/Debug Request
MDM-AP Control: 0x0000001C
Flash Not Ready
============= END SCRIPT =============================
Probe Firmware: OpenSDA CMSIS-DAP (Keil Software)
Serial Number: A000000001
VID:PID: C251:F002
USB Path: \\?\hid#vid_c251&pid_f002#6&12939929&0&0000#{4d1e55b2-f16f-11cf-88cb-001111000030}
Using memory from core 0 after searching for a good core
Cannot halt processor
Request debug reset of DAP
Cannot halt processor
Request debug reset of DAP
( 40) No Halt
debug interface type = Cortex-M0+ (DAP DP ID 0BC11477) over SWD TAP 0
processor type = Cortex-M0+ (CPU ID 00000C60) on DAP AP 0
number of h/w breakpoints = 2
number of flash patches = 0
number of h/w watchpoints = 2
Probe(0): Connected&Reset. DpID: 0BC11477. CpuID: 00000C60. Info: <None>
Debug protocol: SWD. RTCK: Disabled. Vector catch: Disabled.
Content of CoreSight Debug ROM(s):
RBASE F0002000: CID B105100D PID 000008E000 ROM (type 0x1)
ROM 1 E00FF000: CID B105100D PID 04000BB4C0 ROM (type 0x1)
ROM 2 E000E000: CID B105E00D PID 04000BB008 Gen SCS (type 0x0)
ROM 2 E0001000: CID B105E00D PID 04000BB00A Gen DWT (type 0x0)
ROM 2 E0002000: CID B105E00D PID 04000BB00B Gen FPB (type 0x0)
Cannot halt processor
Failed on chip setup: Ep(04). Cannot halt processor.
- 新着としてマーク
- ブックマーク
- 購読
- ミュート
- RSS フィードを購読する
- ハイライト
- 印刷
- 不適切なコンテンツを報告
Hi @Zhong_Shen
If I understand correctly, you were able to debug with J Link firmware.
Regarding the error message, is due to previously active debug configurations. You could follow the tips provided by our colleague Erich Styger on the following thread GDB Debugging with Kinetis Design Studio under section Troubleshooting.
I hope this helps you.
Best regards, Diego.
- 新着としてマーク
- ブックマーク
- 購読
- ミュート
- RSS フィードを購読する
- ハイライト
- 印刷
- 不適切なコンテンツを報告
Hi Diego
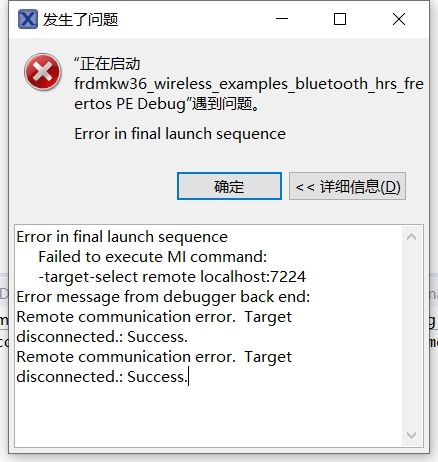
I have encountered some problems when using frdm-kw36, and I need your help.When I use LS or PE debug, the MCUXpresso IDE prompt is shown in the figure.The figure shows debug using PE.But I was successful in erasing and programming frdm-kw36.Just debug doesn't work.
Best regards!
- 新着としてマーク
- ブックマーク
- 購読
- ミュート
- RSS フィードを購読する
- ハイライト
- 印刷
- 不適切なコンテンツを報告
Hi Ren ,
Sorry for the delay.
It seems that the error Target remote localhost:7224 appears if the GDB server cannot be found or if there is something wrong on the launch configuration.
You may already have found and test some of the following recommendations , but I will summarize them:
- Ensure to have the latest binary files for OpenSDA and the latest for [Pemicro Multilink drivers] and [Arm CMSIS-DAP serial drivers]
- Check this troubleshooting guide by our colleage Erich Styger : Debugging Failure: Check List and Hints | MCU on Eclipse
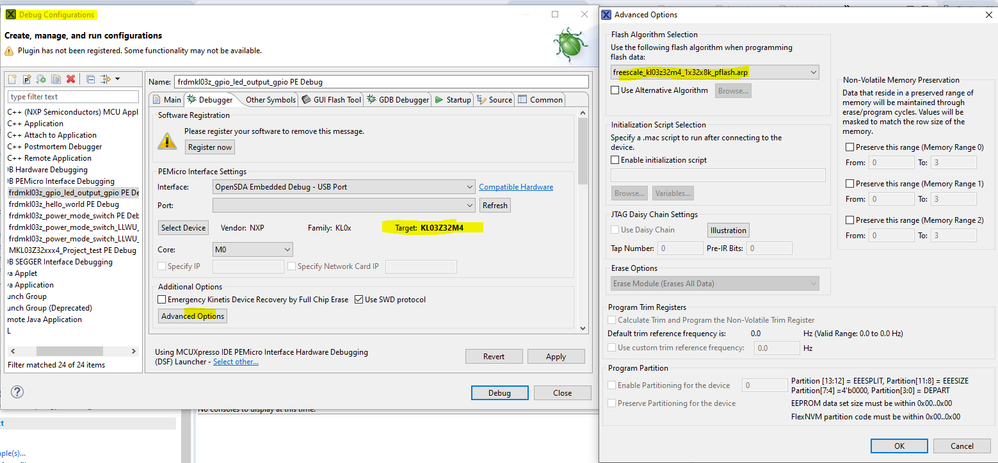
- Check the Debug configuration:
For example with PEmicro, check to have proper target (in my case KL03Z), and flash algoritm:
Coul you help me with the following inquiries:
- Were you able to debug previously, using the same MCUxpresso and driver versions?
- Besides the other recommedations on thist post, there are other recovery paths you evaluated previously without sucess?
Best regards, Diego.
- 新着としてマーク
- ブックマーク
- 購読
- ミュート
- RSS フィードを購読する
- ハイライト
- 印刷
- 不適切なコンテンツを報告
Hi Diego charles
Thank you for your reply. I haven't had this problem before, but it's true of every development board I've encountered recently.The same problem occurred on my computer and my colleagues' computers. I tried LS, PE and Jlink, but none of them worked.I don't know what to do anymore.The following is the error message for Jlink debugging.
SEGGER j-link GDB Server V6.44 I Command Line Version
Compiled May 17 2019 17:34:22 jlinkarm.dll V6.44 I (compiled May 17 2019 17:34:22)
The Command line:-nosilent -swoport 2332 -select USB=59611220 -telnetport 2333 - singlerun-endian little-noir-speed auto-rtos GDBServer/ rtosplugin_freeros-port 2331-powertarget 50-vd-device mkw36z512xxx4-ifSWD - the halt - reportuseraction
-- -- -- -- -- the GDB Server start Settings -- -- -- -- --
GDBInit file: none
GDB Server Listening port: 2331
SWO raw output listening port: 2332
Terminal I/O port: 2333
Accept remote connection: localhost only
The Generate logfile: off
Verify the download: on
Init regs on start: off
Silent mode: off
Use the run mode: on
Target connection timeout: 0 ms
-- -- -- -- -- - J - Link related Settings -- -- -- -- -- -
J - Link Host interface: USB
J - Link script: none
J - Link Settings file: none
-- -- -- -- -- - the Target related Settings -- -- -- -- -- -
The Target device: MKW36Z512xxx4
Target interface: SWD
Target interface speed: auto
Target endian: a little
Connecting to J - Link...
J - the Link is connected.
Device "MKW36Z512XXX4" selected.
Firmware: j-link V9 compiled May 17 2019 09:50:41
The Hardware: V9.60
S/N: 59611220
Feature(s): RDI, GDB, FlashDL, FlashBP, JFlash
Checking target voltage...
Target voltage: 3.35 V
Listening on TCP/IP port 2331
Connecting to the target...InitTarget ()
The Connect Under the Reset
Communication error while ss -AP.
The Connect Under the Reset
InitTarget ()
The Connect Under the Reset
Communication error while ss -AP.
The Connect Under the Reset
ERROR: InitTarget(): PCode returned with ERROR code-1
InitTarget ()
The Connect Under the Reset
Communication error while ss -AP.
The Connect Under the Reset
InitTarget ()
The Connect Under the Reset
Communication error while ss -AP.
The Connect Under the Reset
ERROR: InitTarget(): PCode returned with ERROR code-1
ERROR: Could not connect to target.
Target connection failed. GDBServer will be closed...Restoring the target state and closing J - Link connection...
Shutting down...
Could not connect to target.
Please check power, connection and Settings.
The Server has been shut down.MCUXpresso IDEWireless Connectivity
- 新着としてマーク
- ブックマーク
- 購読
- ミュート
- RSS フィードを購読する
- ハイライト
- 印刷
- 不適切なコンテンツを報告
Hi ren,
Sorry for the delay,
First , make sure that the board is not bricked by erasing the board K20 debug probe and then loading the binary file. For this an external debug probe is required. For details on this go to Freedom OpenSDA Firmware Issues Reported on Windows 10.
Then , try to check if you are able to perform and erase on the target MCU (KW36) . Here are two ways for doing this:
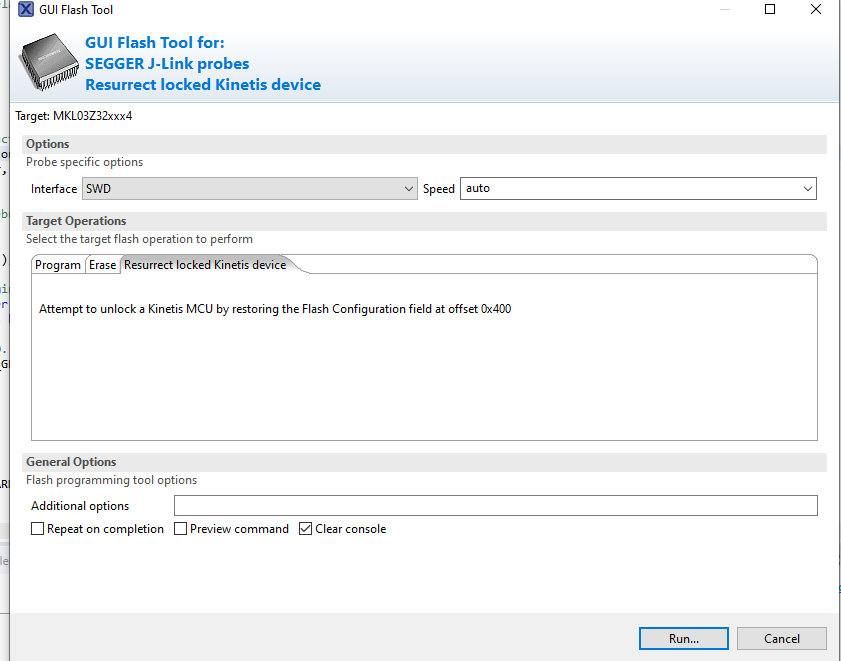
- A) In MCUxpresso, go to GUI flash tool and go to Resurect locked device, then erase the flash memory.
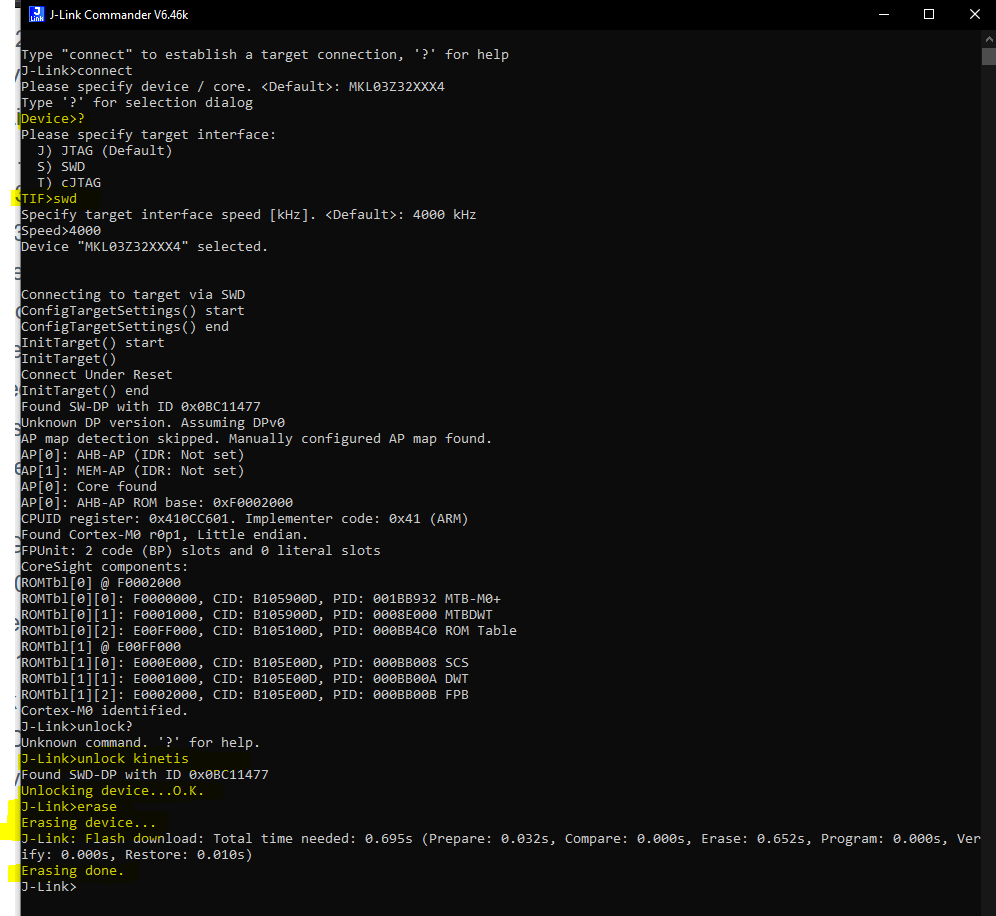
- B) Use J-link commander and connect to the target (KW36), then use commands unlock kinetis and erase.
If you are not able to perform this, please let me know.
Regards,
Diego
- 新着としてマーク
- ブックマーク
- 購読
- ミュート
- RSS フィードを購読する
- ハイライト
- 印刷
- 不適切なコンテンツを報告
Hi Diego Charles
Thanks for your reply!
When I use LS, I can Resurect locked device& erase, but when I use Jlink, I cannot Resurect locked device.I also tried Jlink commander, but I still couldn't connect to core.And no matter what method I use, I can't debug.
- 新着としてマーク
- ブックマーク
- 購読
- ミュート
- RSS フィードを購読する
- ハイライト
- 印刷
- 不適切なコンテンツを報告
Hi Ren,
I apologize for my abscence!
Thank you for providing your output, However I will have to check with my colleagues.
In the meantime, could you help me with the following?
- Create a new path close to the C disk and debug on a blinky project, for exaple: C:/MCUs/blinky .
- Check with an external debugger if you are able to debug by SWD or JTAG
- Provide the error log obtained when you are not able to perform mass erase with J-link.
Regards, Diego
- 新着としてマーク
- ブックマーク
- 購読
- ミュート
- RSS フィードを購読する
- ハイライト
- 印刷
- 不適切なコンテンツを報告
Thanks for you comments.
Delete all launch configurations, and using blue Debug button to start debug. The problem is still existed even reinstall IDE again!
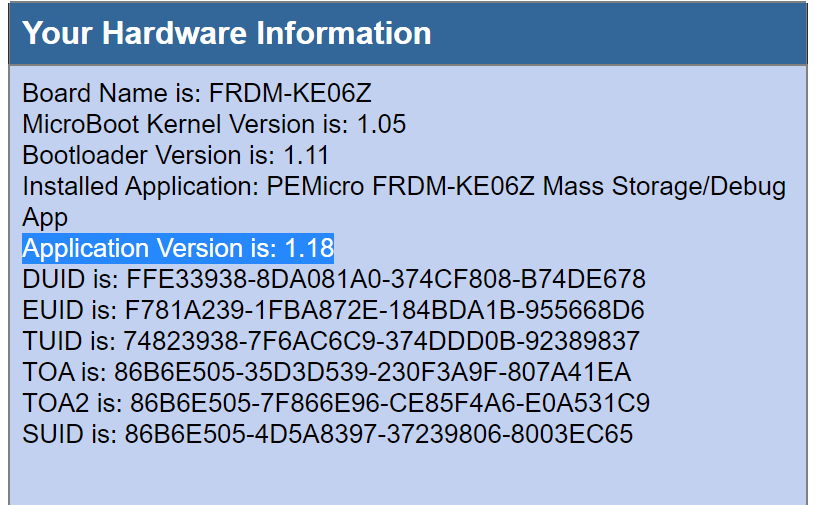
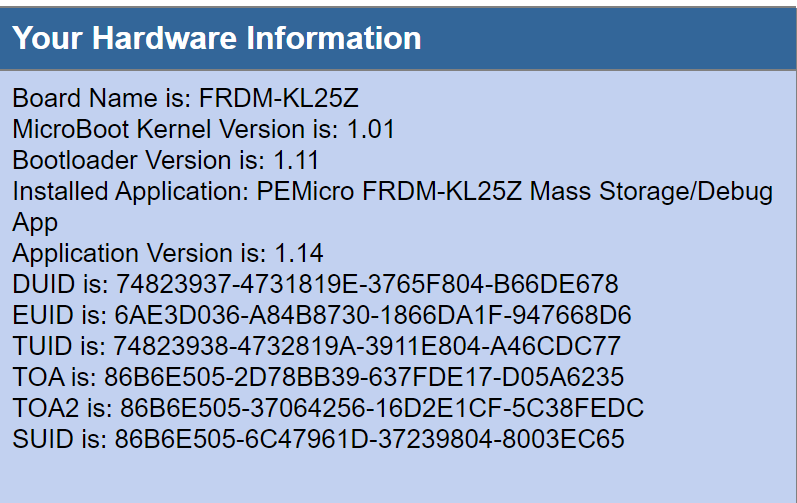
And I try to use a example in SDK for FRDM-KL25Z board, it is OK to launch debug. The OpenSDA version is different: Application Version is: 1.18 on FRDM-KE06Z board and Application Version is: 1.14 on FRDM-KL25Z board.
On linux desktop, MCUXpresso 11.1.0 is OK to launch debug for FRDM-KE06Z board. It is only in windows MCUXpresso 11.1.1 could not launch debug for FRDM-KE06Z board.
- 新着としてマーク
- ブックマーク
- 購読
- ミュート
- RSS フィードを購読する
- ハイライト
- 印刷
- 不適切なコンテンツを報告
Starting debug in MCUXpresso is different to the way you do it in KDS. So delete any launch configuration that you may have created, and start debug using the blue Debug button that is in the QuickStart panel. This is described in the User Guide.
