- Forums
- Product Forums
- General Purpose MicrocontrollersGeneral Purpose Microcontrollers
- i.MX Forumsi.MX Forums
- QorIQ Processing PlatformsQorIQ Processing Platforms
- Identification and SecurityIdentification and Security
- Power ManagementPower Management
- Wireless ConnectivityWireless Connectivity
- RFID / NFCRFID / NFC
- Advanced AnalogAdvanced Analog
- MCX Microcontrollers
- S32G
- S32K
- S32V
- MPC5xxx
- Other NXP Products
- S12 / MagniV Microcontrollers
- Powertrain and Electrification Analog Drivers
- Sensors
- Vybrid Processors
- Digital Signal Controllers
- 8-bit Microcontrollers
- ColdFire/68K Microcontrollers and Processors
- PowerQUICC Processors
- OSBDM and TBDML
- S32M
- S32Z/E
-
- Solution Forums
- Software Forums
- MCUXpresso Software and ToolsMCUXpresso Software and Tools
- CodeWarriorCodeWarrior
- MQX Software SolutionsMQX Software Solutions
- Model-Based Design Toolbox (MBDT)Model-Based Design Toolbox (MBDT)
- FreeMASTER
- eIQ Machine Learning Software
- Embedded Software and Tools Clinic
- S32 SDK
- S32 Design Studio
- GUI Guider
- Zephyr Project
- Voice Technology
- Application Software Packs
- Secure Provisioning SDK (SPSDK)
- Processor Expert Software
- Generative AI & LLMs
-
- Topics
- Mobile Robotics - Drones and RoversMobile Robotics - Drones and Rovers
- NXP Training ContentNXP Training Content
- University ProgramsUniversity Programs
- Rapid IoT
- NXP Designs
- SafeAssure-Community
- OSS Security & Maintenance
- Using Our Community
-
- Cloud Lab Forums
-
- Knowledge Bases
- ARM Microcontrollers
- i.MX Processors
- Identification and Security
- Model-Based Design Toolbox (MBDT)
- QorIQ Processing Platforms
- S32 Automotive Processing Platform
- Wireless Connectivity
- CodeWarrior
- MCUXpresso Suite of Software and Tools
- MQX Software Solutions
- RFID / NFC
- Advanced Analog
-
- NXP Tech Blogs
- Home
- :
- 汎用マイクロコントローラ
- :
- LPCマイクロコントローラ
- :
- Debug in _WFI mode?
Debug in _WFI mode?
- RSS フィードを購読する
- トピックを新着としてマーク
- トピックを既読としてマーク
- このトピックを現在のユーザーにフロートします
- ブックマーク
- 購読
- ミュート
- 印刷用ページ
Debug in _WFI mode?
- 新着としてマーク
- ブックマーク
- 購読
- ミュート
- RSS フィードを購読する
- ハイライト
- 印刷
- 不適切なコンテンツを報告
Hello to all,
I am trying to see, what's happening to the program inside the _WFI() mode, but when I try to do so in debug mode. It doesn't proceed further and forcefully we need to stop the debug operation. Does any body know how to deal with such a small issue??
Thanking you,
-Regards,
Himanshu Doshi
- 新着としてマーク
- ブックマーク
- 購読
- ミュート
- RSS フィードを購読する
- ハイライト
- 印刷
- 不適切なコンテンツを報告
When the cpu encounters a WFI instruction, it basically goes into a simple low power mode, and will no longer execute any instructions until an interrupt is triggered, at which point it will wake up again and enter the appropriate interrupt handler. Thus whilst in WFI "mode", waiting for an interrupt to happen, your application has basically stopped executing.
From a debug point of view, depending on your debug tools, it is possible that your debugger might actually time out the debug connection whilst the cpu is in WFI "mode" if an interrupt is not triggered within a certain timeframe. But in most cases, your system will probably have at least one interrupt triggering on a regular enough basis (such as Systick, or another timer), for the WFI to effectively be "invisible" from the debug point of view.
Regards,
MCUXpresso IDE Support
- 新着としてマーク
- ブックマーク
- 購読
- ミュート
- RSS フィードを購読する
- ハイライト
- 印刷
- 不適切なコンテンツを報告
Hi Himanshu Doshi,
The execution of the WFI instruction will cause immediate entry to the sleep or deep sleep power modes, no more code is executed after this instruction. Sleep mode is exited automatically when an interrupt enabled by the NVIC arrives at the processor or a reset occurs. Please see the User Manual for details on which interrupt sources are connected to NVIC.
Hope it helps!
Best Regards,
Carlos Mendoza
Technical Support Engineer
- 新着としてマーク
- ブックマーク
- 購読
- ミュート
- RSS フィードを購読する
- ハイライト
- 印刷
- 不適切なコンテンツを報告
Hello, Mr. Mendoza
Thank you very much for your reply. I am using SysTick_Handler to get the interrupt in WFI (sleep mode). And, there is a piece of code written in the SysTick_Handler. Can you suggest me how should I debug the code inside the SysTick???
The piece of code looks like this:
void SysTick_Handler(void)
{
asm(
"STR.W R3,[R7]\t\n"
"STR.W R4,[R3]\t\n"
"STR.W R5,[R4]\t\n"
);
}
Thanking you once again,
Regards,
Himanshu
- 新着としてマーク
- ブックマーク
- 購読
- ミュート
- RSS フィードを購読する
- ハイライト
- 印刷
- 不適切なコンテンツを報告
Hi Himanshu,
Are you able to set a breakpoint inside the systick handler? If the debug connection gets lost because of the low power mode being used you could try attaching to the system as explained to Simon.
Hope it helps!
Best Regards,
Carlos Mendoza
Technical Support Engineer
- 新着としてマーク
- ブックマーク
- 購読
- ミュート
- RSS フィードを購読する
- ハイライト
- 印刷
- 不適切なコンテンツを報告
Hello Carlos Mendoza,
Thank you very much for your reply. As suggested by you, I have provided a toggle break point into the _WFI program, but while debugging, an error was flashing at the bottom of IDE: "Stalled on bus operation". I have restarted the IDE and try again but it's the same and also the same thing happened on the debugger configuration to make attach only option true. Can you comment on it??
How to debug a program in the _WFI mode??
Regards,
Himanshu
- 新着としてマーク
- ブックマーク
- 購読
- ミュート
- RSS フィードを購読する
- ハイライト
- 印刷
- 不適切なコンテンツを報告
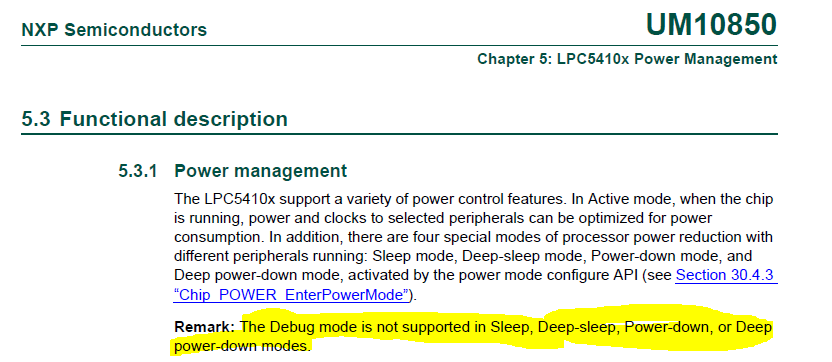
According to the user manual UM10805 Page 80 it is NOT possible to debug the low-power modes. (http://www.nxp.com/docs/en/user-guide/UM10850.pdf )
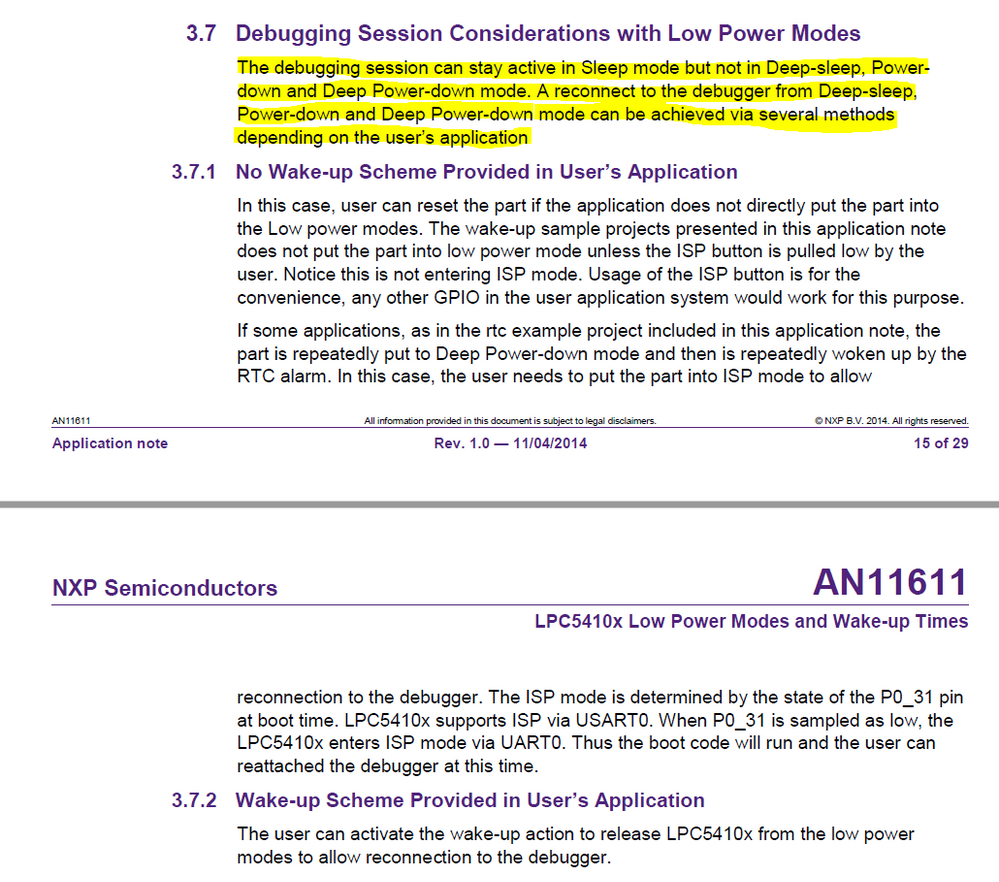
But in the appnote AN11611 is written that the debugger can be reconnected. However, NXP doesn't write in the appnote, how the reconnection could be accomplished.
NXP, can you give use some advice?
I also like to know, how I can restart the debugger if I had previous finished the debug session and the code has not changed until now (no recompilation and flashing required).
- 新着としてマーク
- ブックマーク
- 購読
- ミュート
- RSS フィードを購読する
- ハイライト
- 印刷
- 不適切なコンテンツを報告
Hi Simon,
You should use the "Attach Only" option in the debug configurations, this will allow you to debug a running system:
https://community.nxp.com/message/630604
Hope it helps!
Best Regards,
Carlos Mendoza
Technical Support Engineer

