- Forums
- Product Forums
- General Purpose MicrocontrollersGeneral Purpose Microcontrollers
- i.MX Forumsi.MX Forums
- QorIQ Processing PlatformsQorIQ Processing Platforms
- Identification and SecurityIdentification and Security
- Power ManagementPower Management
- Wireless ConnectivityWireless Connectivity
- RFID / NFCRFID / NFC
- Advanced AnalogAdvanced Analog
- MCX Microcontrollers
- S32G
- S32K
- S32V
- MPC5xxx
- Other NXP Products
- S12 / MagniV Microcontrollers
- Powertrain and Electrification Analog Drivers
- Sensors
- Vybrid Processors
- Digital Signal Controllers
- 8-bit Microcontrollers
- ColdFire/68K Microcontrollers and Processors
- PowerQUICC Processors
- OSBDM and TBDML
- S32M
- S32Z/E
-
- Solution Forums
- Software Forums
- MCUXpresso Software and ToolsMCUXpresso Software and Tools
- CodeWarriorCodeWarrior
- MQX Software SolutionsMQX Software Solutions
- Model-Based Design Toolbox (MBDT)Model-Based Design Toolbox (MBDT)
- FreeMASTER
- eIQ Machine Learning Software
- Embedded Software and Tools Clinic
- S32 SDK
- S32 Design Studio
- GUI Guider
- Zephyr Project
- Voice Technology
- Application Software Packs
- Secure Provisioning SDK (SPSDK)
- Processor Expert Software
- Generative AI & LLMs
-
- Topics
- Mobile Robotics - Drones and RoversMobile Robotics - Drones and Rovers
- NXP Training ContentNXP Training Content
- University ProgramsUniversity Programs
- Rapid IoT
- NXP Designs
- SafeAssure-Community
- OSS Security & Maintenance
- Using Our Community
-
- Cloud Lab Forums
-
- Knowledge Bases
- ARM Microcontrollers
- i.MX Processors
- Identification and Security
- Model-Based Design Toolbox (MBDT)
- QorIQ Processing Platforms
- S32 Automotive Processing Platform
- Wireless Connectivity
- CodeWarrior
- MCUXpresso Suite of Software and Tools
- MQX Software Solutions
- RFID / NFC
- Advanced Analog
-
- NXP Tech Blogs
- Home
- :
- General Purpose Microcontrollers
- :
- Kinetis Microcontrollers
- :
- Re: HVPKV58F PEMicro JTAG Debugging Issue
HVPKV58F PEMicro JTAG Debugging Issue
- Subscribe to RSS Feed
- Mark Topic as New
- Mark Topic as Read
- Float this Topic for Current User
- Bookmark
- Subscribe
- Mute
- Printer Friendly Page
HVPKV58F PEMicro JTAG Debugging Issue
- Mark as New
- Bookmark
- Subscribe
- Mute
- Subscribe to RSS Feed
- Permalink
- Report Inappropriate Content
Error Messages
semihost ==> Could not connect to semihosting port ...
debugging console ==> monitor command not supported by this target
I bringing up the HVPKV58F board to try out some baremetal code that I developed on the twkv58f220m.
I am using MCUExpresso v10.31.1 (build 2233)
I have the HVPKV58F Expresso SDK install and I just trying to run hello world example.
My debugger is a PE Micro Multilink Universal FX.
When I launch the debugger it tries to debug but it gets to point (61% and dies)
Semihost console says
Copyright (C) 2018 Free Software Foundation, Inc.
License GPLv3+: GNU GPL version 3 or later <http://gnu.org/licenses/gpl.html>
This is free software: you are free to change and redistribute it.
There is NO WARRANTY, to the extent permitted by law. Type "show copying"
and "show warranty" for details.
This GDB was configured as "--host=i686-w64-mingw32 --target=arm-none-eabi".
Type "show configuration" for configuration details.
For bug reporting instructions, please see:
<http://www.gnu.org/software/gdb/bugs/>.
Find the GDB manual and other documentation resources online at:
<http://www.gnu.org/software/gdb/documentation/>.
For help, type "help".
Type "apropos word" to search for commands related to "word".monitor selectcore 0
"monitor" command not supported by this target.
continue
The program is not being run.
(few more details)
Powering up HPV through USB 5V only not data lines
Powering debugger through J10 header
Normally debugging with 20 pin PE Micro Universal cable this target uses 10 pin cable.
Debugger seems happy both the blue and yellow lights are lit.
Regards,
Mich
- Mark as New
- Bookmark
- Subscribe
- Mute
- Subscribe to RSS Feed
- Permalink
- Report Inappropriate Content
Hi Jeff,
Please download HVP-KV58 SDK from Welcome | MCUXpresso SDK Builder and try again.
Semihost use UART port. In HVP-KV58, openSDA connect to UART1. But in TWR-KV58, openSDA connect to UART0. So, semihost connection can't establish.
Regards,
Jing
- Mark as New
- Bookmark
- Subscribe
- Mute
- Subscribe to RSS Feed
- Permalink
- Report Inappropriate Content
Jing,
>>Please download HVP-KV58 SDK from Welcome | MCUXpresso SDK Builder and try again.
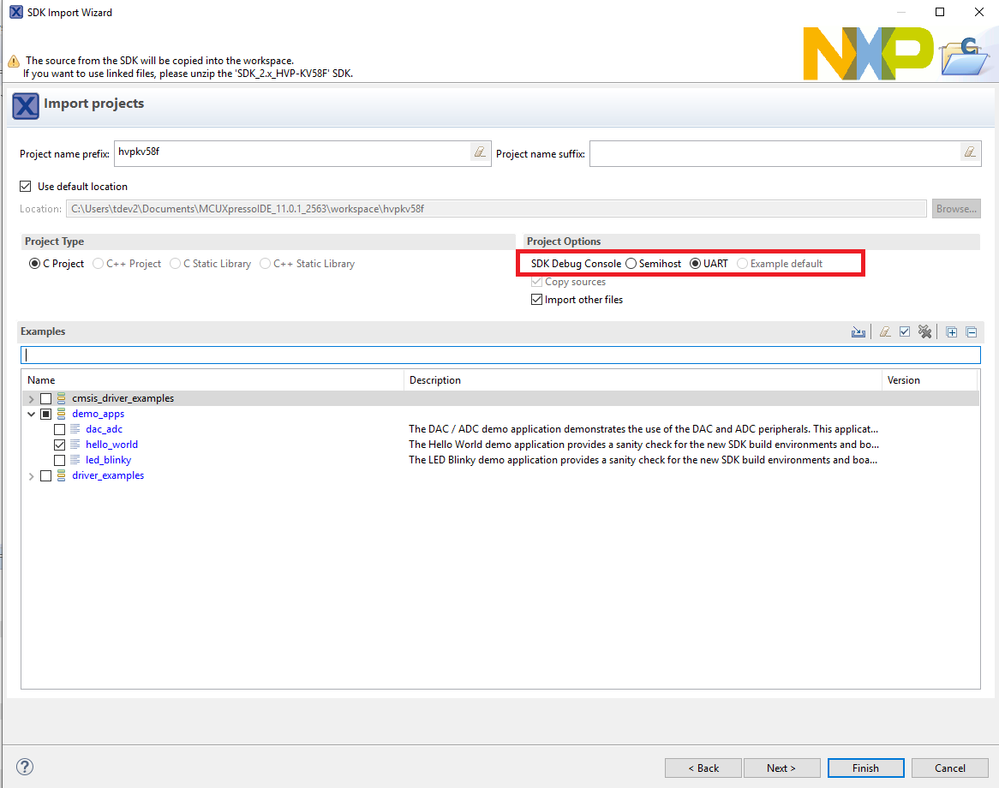
I am importing hello_world application from the HVP-KV58 SDK v2.6 on MCUExpresso 11.0.1
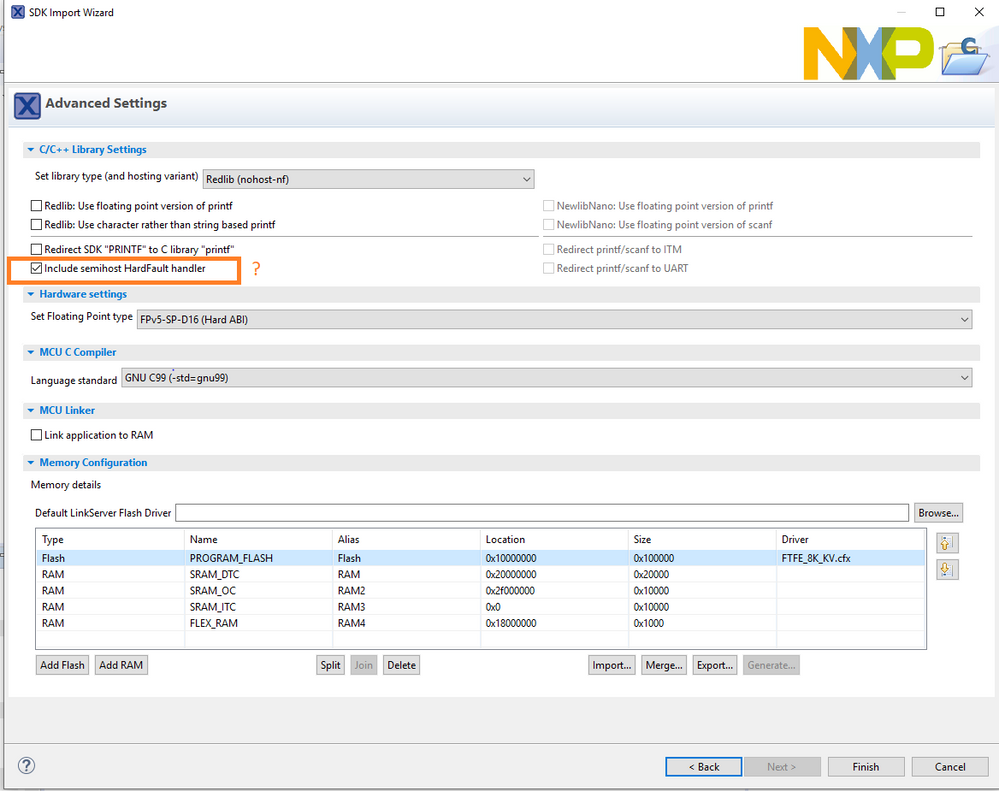
Base on you suggestions this what I tried. See screen dumps and code.
OK here was what I tried this morning.
#ifndef _BOARD_H_
#define _BOARD_H_
#include "clock_config.h"
#include "fsl_gpio.h"
/*******************************************************************************
* Definitions
******************************************************************************/
/*! @brief The board name */
#define BOARD_NAME "HVP-KV58F"
/*! @brief The UART to use for debug messages. */
#define BOARD_USE_UART
#define BOARD_DEBUG_UART_TYPE kSerialPort_Uart
#define BOARD_DEBUG_UART_BASEADDR (uint32_t) UART1
#define BOARD_DEBUG_UART_INSTANCE 1U
...
I also tried to comment out the console. Just see if I could step through main.
void BOARD_InitDebugConsole(void)
{
uint32_t uartClkSrcFreq = BOARD_DEBUG_UART_CLK_FREQ;
/// \note JCM DbgConsole_Init(BOARD_DEBUG_UART_INSTANCE, BOARD_DEBUG_UART_BAUDRATE, BOARD_DEBUG_UART_TYPE, uartClkSrcFreq);
}
Similar results at the :
GDB CONSOLE
687,364 &"The program is not being run.\n"
687,364 ^error,msg="The program is not being run."
687,364 (gdb)
687,364 35^error,msg="Invalid thread id: 1"
687,364 (gdb)
687,365 36-stack-info-depth --thread 1
687,372 37-data-disassemble --thread 1 -s 4294967294 -e 4294967338 -- 3
687,372 38-thread-info 1
687,373 39-list-thread-groups
687,375 36^error,msg="Invalid thread id: 1"
687,375 (gdb)
687,375 37^error,msg="Invalid thread id: 1"
687,375 (gdb)
687,375 38^done,threads=[]
687,375 (gdb)
687,375 39^done,groups=[{id="i1",type="process"}]
687,375 40-stack-list-frames --thread 1
687,376 (gdb)
687,384 41-data-disassemble --thread 1 -s 4294967295 -e 4294967347 -- 3
687,386 40^error,msg="Invalid thread id: 1"
687,386 (gdb)
687,386 41^error,msg="Invalid thread id: 1"
687,386 (gdb)
687,398 42-data-disassemble --thread 1 -s 4294967296 -e 4294967348 -- 3
687,408 42^error,msg="Invalid thread id: 1"
687,408 (gdb)
687,789 43-gdb-exit
687,791 43^exit
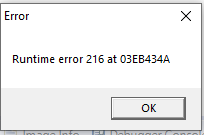
But this time I got the following error
---------------------------------------
However, I think I may have narrowed in this issue to be a FLASH write error.
PEGDBSERVER_CONSOLE OUTPUT
Loading programming algorithm ...
Done.
Programming sequency is : erase, blank check, program, and verify {default}
CMD>VC
Command is inactive for this .ARP file.
VC is not implemented, falling back to VM
CMD>VM
Verifying.
Verify error at address $10000002.
Byte in module is $00 and should be $02.
Current content of flash does not match application to be programmed
CMD>EM
Command is inactive for this .ARP file.
Error Erasing flash of device
Error occured during Flash programming.
-------------
The question is why. Is the algorithm, the location or a issue with the hardware?
This is where I am at.
Regards.
Mich
- Mark as New
- Bookmark
- Subscribe
- Mute
- Subscribe to RSS Feed
- Permalink
- Report Inappropriate Content
Hi,
HVP has on board openSDA debug port. Can you try to use it to debug? I wonder the openSDA's SWD signal may conflict with your PE.
Regards,
Jing


