- Forums
- Product Forums
- General Purpose MicrocontrollersGeneral Purpose Microcontrollers
- i.MX Forumsi.MX Forums
- QorIQ Processing PlatformsQorIQ Processing Platforms
- Identification and SecurityIdentification and Security
- Power ManagementPower Management
- Wireless ConnectivityWireless Connectivity
- RFID / NFCRFID / NFC
- MCX Microcontrollers
- S32G
- S32K
- S32V
- MPC5xxx
- Other NXP Products
- S12 / MagniV Microcontrollers
- Powertrain and Electrification Analog Drivers
- Sensors
- Vybrid Processors
- Digital Signal Controllers
- 8-bit Microcontrollers
- ColdFire/68K Microcontrollers and Processors
- PowerQUICC Processors
- OSBDM and TBDML
- S32M
-
- Solution Forums
- Software Forums
- MCUXpresso Software and ToolsMCUXpresso Software and Tools
- CodeWarriorCodeWarrior
- MQX Software SolutionsMQX Software Solutions
- Model-Based Design Toolbox (MBDT)Model-Based Design Toolbox (MBDT)
- FreeMASTER
- eIQ Machine Learning Software
- Embedded Software and Tools Clinic
- S32 SDK
- S32 Design Studio
- GUI Guider
- Zephyr Project
- Voice Technology
- Application Software Packs
- Secure Provisioning SDK (SPSDK)
- Processor Expert Software
-
- Topics
- Mobile Robotics - Drones and RoversMobile Robotics - Drones and Rovers
- NXP Training ContentNXP Training Content
- University ProgramsUniversity Programs
- Rapid IoT
- NXP Designs
- SafeAssure-Community
- OSS Security & Maintenance
- Using Our Community
-
- Cloud Lab Forums
-
- Knowledge Bases
- ARM Microcontrollers
- i.MX Processors
- Identification and Security
- Model-Based Design Toolbox (MBDT)
- QorIQ Processing Platforms
- S32 Automotive Processing Platform
- Wireless Connectivity
- CodeWarrior
- MCUXpresso Suite of Software and Tools
- MQX Software Solutions
-
- Home
- :
- General Purpose Microcontrollers
- :
- Kinetis Microcontrollers
- :
- Debug hangs on WDOG_EWM_IRQHandler()
Debug hangs on WDOG_EWM_IRQHandler()
- Subscribe to RSS Feed
- Mark Topic as New
- Mark Topic as Read
- Float this Topic for Current User
- Bookmark
- Subscribe
- Mute
- Printer Friendly Page
Debug hangs on WDOG_EWM_IRQHandler()
- Mark as New
- Bookmark
- Subscribe
- Mute
- Subscribe to RSS Feed
- Permalink
- Report Inappropriate Content
Hello,
I am working with MK60DN512VMD10 controller and created a project in KDS using processor expert mode in freertos/ksdk1.3.0.
When I am debugging the code, after sometime it, halt to WDOG_EWM_IRQHandler() in defaultISR.
I don't understand why this is happening? Please help.
Regards
Utsavi Bharuchwala
- Mark as New
- Bookmark
- Subscribe
- Mute
- Subscribe to RSS Feed
- Permalink
- Report Inappropriate Content
This is almost certainly caused by an unhandled interrupt being fired. Your debugger thinks that WDOG_EWM_IRQHandler() is being called but actually it's just showing that method name because alphabetically it's the last method which is aliased with DefaultISR.
Check your code to see which interrupts are enabled, then write ISR methods which override the defaults. Systick is probably a good place to start.
- Mark as New
- Bookmark
- Subscribe
- Mute
- Subscribe to RSS Feed
- Permalink
- Report Inappropriate Content
Hello Don Turner,
Thanks for quick reply. From the code I can see that below isr are enabled.
ADC, DSPI, EDMA, ENET, GPIO, PDB, PIT, SDHC
Isr Method is already written for this. How to prevent this defaultISR? From debug I am unable to find which ISR is fired.
Regards
Utsavi Bharuchwala
- Mark as New
- Bookmark
- Subscribe
- Mute
- Subscribe to RSS Feed
- Permalink
- Report Inappropriate Content
Yet another case where a better default-IRQ-handler would be of MUCH assistance.
That routine's output looks like this, and starts with the incurred vector# (I2S0_RX in this case, in K22F):
INFO: [Fault handler, #45]
R0 = 73
R1 = 73
R2 = 73
R3 = 4006a003
R12 = 6
LR = 17d81
PC = 17db6
PSR = 81000000
BFAR = e000ed38
CFSR = 0
HFSR = 0
DFSR = 0
AFSR = 0
This is the typical result of an unhandled vector --- none of the registers actually mean anything (just the point in time when the vector was taken).
For this next example, I turned off write buffering (using my IAR header-names SCB_ACTLR |= SCB_ACTLR_DISDEFWBUF_MASK; //Needed to track down write-faults, normally commented-out!!!):
[Fault handler, #3]
R0 = 4002f000
R1 = 4
R2 = c0
R3 = 1fff3889
R12 = 0
LR = 4687
PC = 113e4
PSR = 1000000
BFAR = 4002f004
CFSR = 8200
HFSR = 40000000
DFSR = 0
AFSR = 0
In particular, this 'very common hard fault (#3)' shows a write to my I2S0 peripheral w/o having first enabled the clock (powered it up). R0 is the base-address of I2S0, the Bus Fault Address Register shows an indexed-access 4 higher (because I turned off write-buffering, else it wouldn't hold any valid value!), and PC points directly to the 'STR R1, [R0, #0x4]' instruction involved (again because I turned off write buffering, else PC will have moved-on by several instruction cycles) and LR to the calling-point to said driver.
- Mark as New
- Bookmark
- Subscribe
- Mute
- Subscribe to RSS Feed
- Permalink
- Report Inappropriate Content
Hello Earl Goodrich,
Thanks for reply.
Did you mean that I have to create DefaultISR handler()? Should I have to write hard_fault_handler_c() in my code (as per suggested in MMFAR & BFAR read )? Should I need to debug in defaultISR in deep?
Should I need to write __get_IPSR() and disable_irq() in my code?
I am really unable to understand. Please help me understanding this.
Will it prevent program hang from DefaultISR?
Can I write something like this in my code?
if(NVIC_GetActive(WDOG_EWM_IRQn)) //if Watchdog exception is activate then disable it...
NVIC_DisableIRQ(WDOG_EWM_IRQn);
Please suggest.
Regards
Utsavi Bharuchwala
- Mark as New
- Bookmark
- Subscribe
- Mute
- Subscribe to RSS Feed
- Permalink
- Report Inappropriate Content
It certainly seems that our first order of business is to figure out which vector# is dropping you into the default-handler (of ALL the named labels that fall into it!). You SHOULD be able to just run your code in your debugger, and when you get to the default handler 'break' and have your debugger just read IPSR for you. Until we know what vector, it is 'pointless' to speculate on a course of action.
I suggested that you replace the contents of your current DefaultISR with the code I put in that other thread, starting with the assembly-code into MK60D10.s in your setup, instead of the assembly code at that point where all the 'unused vectors' now point to, and let that assembly talk to the vectors.c I attached, and thereby get this critical information direct on your console.
You still seem 'hung up' on this being an actual WDOG event, but as mentioned in the first reply this 'name' you see is surely just a 'convenient handle' the compiler and linker have chosen to show for the DefaultISR, and is MOST LIKELY NOT the hardware causing the exception.
- Mark as New
- Bookmark
- Subscribe
- Mute
- Subscribe to RSS Feed
- Permalink
- Report Inappropriate Content
Hello Earl Goodrich,
Thanks for making me understand.
As per your suggestions, to write content in DefaultISR function, I search it, but I found it nowhere.
I added hardfault component, and write DefaultISR handler like this in my event.c file.,
void DefaultISR(void)
{
volatile uint32_t fault_isr = 0;
fault_isr = __get_IPSR() & 0x1FF;
printf ("[Fault handler, #%u]\n",fault_isr);
HF1_HardFaultHandler();
}
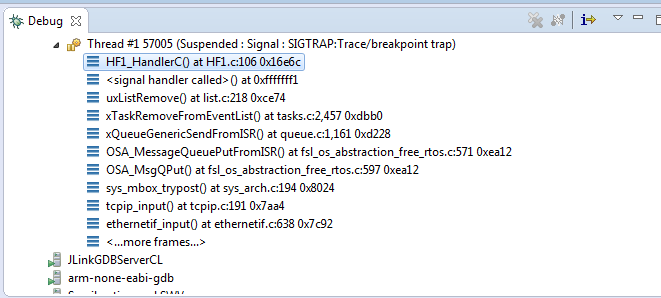
When my debug stucks, I am able to see that, there are lost of ISR functions in my debug window in thread 1.(Please see image below).
One more thing, register values like CFSR, HFSR, BFSR etc are coming different every time on different debug.
Registers on 1st debug on 2nd debug on 3rd debug
stacked_r0 = 0x20010000 0x20006fa8 0x1a
stacked_r1 = 0x0 0x20005cf4 0x0
stacked_r2 = 0x1fff55c8 0x20005cf4 0x0
stacked_r3 = 0x1fff57a0 0x20005cec 0xe2090000
stacked_r12 = 0x14e9f 0xa5a5a5a5 0x14e9f
stacked_lr = 0xfffffffd 0xdbc9 0xdbb1
stacked_pc = 0xe23e 0xce8c 0xce74
stacked_psr = 0x6100000e 0x1000000 0x6100005d
CFSR = 0x8200 0x8600 0x400
HFSR = 0x40000000 0x40000000 0x40000000
DFSR = 0x1 0x1 0x1
AFSR = 0x0 0x0 0x0
MMAR = 0x20010000 0xe2210004 0xe000ed34
BFAR = 0x20010000 0xe2210004 0xe000ed38
( From CFSR regiester, I got the fault like,
In 1st debug: BusFault- PRECISERR
UsageFault - NOCP
In 2nd Debug: BusFault- PRECISERR,IMPRECISERR
UsageFault - NOCP
In 3rd Debug: BusFault- PRECISERR
Description of this registers I got from DUI0553A_cortex_m4_dgug.pdf )
Though there is dissimilarities in register values, I got same ISR functions is debug window and I got the same value for fault_isr, that is 3.
Now in my MK60D10.h file,
/* Device specific interrupts */
DMA3_IRQn = 3, /**< DMA channel 3 transfer complete */
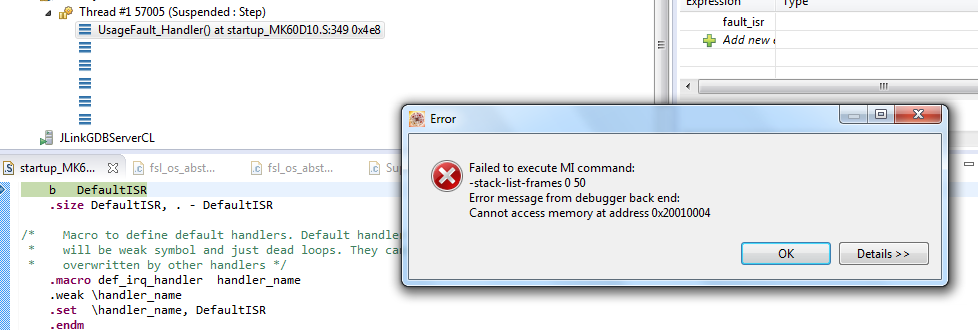
One more thing on debug stucks, I got the popup indicating me "cannot access memory at address 0x20010004" (see
image below). What is this indicating?
Is this creating a stuck?
I also tried to disable my dmacontroller component,disabled tasks which are using this dma facilities, but still my code stucks.
Should I have to look for dmaISR function, or for Isr functions which are indicated in debug window like, uxListremove() or xTaskRemoveFromEventList() or xQueueGenericSenfFromISR etc...?
How to solve this stucking problem? Which ISR is causing a problem? How to know that?
Please suggest what do next.
Also am I progressing on right direction?
Regards
Utsavi Bharuchwala
- Mark as New
- Bookmark
- Subscribe
- Mute
- Subscribe to RSS Feed
- Permalink
- Report Inappropriate Content
There is, unfortunately, a serious point of confusion in the ARM architecture on interrupt/vector numbering. So while NVIC IRQ #3 is that DMA you mention, what IPSR indicates is the true vector number, where the NVIC interrupts start at 16, and the first 16 vectors are 'fixed' ARM-core exceptions. ARM #3 is, as I previously indicated, the Hard Fault, which indicates an invalid bus access. Your debugger seems also to be trying to access an address 'just above' your available RAM addresses, so the debugger interface hits the same 'hard fault' and displays that box. You will have to know more about your debugger to know what other register, watch-window, memory-window, etc. contents are asking to display a value from that invalid address.
Now it does seem 'odd' that the registers at time of exception are always different, and not particularly much help. What code routines can you identify at the two different PC-address areas? The first fault seems to be from within an interrupt handler (due to LR contents), but at least that is showing the same 'just past RAM' fault address in BFAR, so I would look into that exact code for a pointer (or stack underflow???) problem, or even 'heap overflow' (and given your previous post on 'RAM allocation trouble' this seems 'most likely'!). Do you have a facility to monitor free-RAM allocation?
I would also recommend you hit that 'disable write buffer' bit in the system ACTL register in your chip init so we eliminate imprecise-errors and PC-value 'drift' on delayed write-faults.
- Mark as New
- Bookmark
- Subscribe
- Mute
- Subscribe to RSS Feed
- Permalink
- Report Inappropriate Content
Hello Earl Goodrich,
Sorry for late reply.
As per your suggestion, I set disable write buffer bit(SCB_ACTLR_DISDEFWBUF_MASK) in ACTLR register.
By doing this my task hangs on defaultISR. How can I identify which task and which variable is generating faulty address? How to know the code placed at different pc address?
How can I check free RAM allocation?
One more thing,
I test default lwip_tcpecho_demo_freertos_twrk60d100m. I put it under stress testing at 1000msec but it stucks!!! KSDK demo stucks...!! Thats very strange..
Again I go through lwip_udpecho_demo_freertos_twrk60d100m, which is working and running perfectly.
To test TCP, I made a task which is only sending data (not receiving any data). This task is working well.
I am suprise,there is problem in TCP receive portion. From study I come across "KSDK ethernet example results in crash ". The same thing is happening in my case.
Can you tell me how can I use xTimerPendFunctionCallFromISR()?
It is clearly indicating that UDP is working forever and TCP stucks after sometime in link "FreeRTOS Real Time Kernel (RTOS) / Discussion / Open Discussion and Support:TCP/IP stack performance... "
And as per discussion in this link, #define ENET_RECEIVE_ALL_INTERRUPT 0 already defined in my project.
Any further solution from your side?
Regards
Utsavi Bharuchwala
- Mark as New
- Bookmark
- Subscribe
- Mute
- Subscribe to RSS Feed
- Permalink
- Report Inappropriate Content
I was afraid you'd disappeared!
I am a 'low level' guy, and can't help so much with the 'higher level' stuff. I can only ASSUME that FreeRTOS has a 'free memory check' function. And I certainly can't give any advice on TCP/UDP stack problems, although from your other links it certainly looks like FreeRTOS may indeed 'have a problem' (or at least be 'hard to work with!) in this realm.
To look further at this low level, gather a list of PC & BFAR contents at each fault, and use your linker-map to see if you can form a pattern. But, if as before a 'large percentage' seem to access 'beyond the end of RAM' then I think you can expect that ALL 'odd' behavior is due to your heap colliding with (and corrupting) your stack (leading to all manner of 'weird' and 'random' errors), and if THAT isn't fatal then continuing allocation 'off the end'. The trouble with this kind of problem is that even after you FIND the user of dynamically-allocated-memory that gives a fault, you have to work backwards to find the MALLOC for that structure, and there is no 'particular reason' for the one you find to be the MALLOC that 'leaks' on you (never gets returned), and even then you have to find where said 'leak' WOULD be returned to the heap and see why THAT doesn't run... You have indeed fallen into 'one of the most difficult' bugs to sort out...
I think I have to recommend you move over to the proven uTasker solution environment.
- Mark as New
- Bookmark
- Subscribe
- Mute
- Subscribe to RSS Feed
- Permalink
- Report Inappropriate Content
Hi
You could temporarily add a handler for every possible interrupt source so that it is clear which one fired.
It may be that there was not an interrupt though and you hits this line due to runaways code (eg. a pointer being corrupted and a jump being made to the handler itself) which will require standard debugging techniques (trace may help if available).
In case you need solid TCP/IP stack for your chip you can get it from http://www.utasker.com/kinetis/TWR-K60D100M.html (it can also be used with FreeRTOS) or if you need to fix the example code quickly there is a professional service available at http://www.utasker.com/support.html
Regards
Mark
- Mark as New
- Bookmark
- Subscribe
- Mute
- Subscribe to RSS Feed
- Permalink
- Report Inappropriate Content
Hi
I doubt also that this has anything to do with the watchdog interrupt - when the watchdog interrupt fires the processor resets unconditionally 256 clock cycles later and the debugger will tend not to be able to show that this interrupt was hit - instead the debugger will show the reset vector.
Regards
Mark
- Mark as New
- Bookmark
- Subscribe
- Mute
- Subscribe to RSS Feed
- Permalink
- Report Inappropriate Content
Hi Mark,
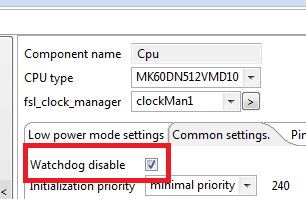
Thanks for reply. As you said, it is possible that watchdog interrupt is fired. But from the CPU component I can see that Watchdog is disabled. Please see the snap below.
How can watchdog interrupt triggered?? End though it is triggering then how can I prevent that?
There is no problem in our code at startup but,whenever our Ethernet task(TCP communication) start and after apprx 10min later task hang on DefaultISR.
Regards
Utsavi Bharuchwala


