- Forums
- Product Forums
- General Purpose MicrocontrollersGeneral Purpose Microcontrollers
- i.MX Forumsi.MX Forums
- QorIQ Processing PlatformsQorIQ Processing Platforms
- Identification and SecurityIdentification and Security
- Power ManagementPower Management
- MCX Microcontrollers
- S32G
- S32K
- S32V
- MPC5xxx
- Other NXP Products
- Wireless Connectivity
- S12 / MagniV Microcontrollers
- Powertrain and Electrification Analog Drivers
- Sensors
- Vybrid Processors
- Digital Signal Controllers
- 8-bit Microcontrollers
- ColdFire/68K Microcontrollers and Processors
- PowerQUICC Processors
- OSBDM and TBDML
- S32M
-
- Solution Forums
- Software Forums
- MCUXpresso Software and ToolsMCUXpresso Software and Tools
- CodeWarriorCodeWarrior
- MQX Software SolutionsMQX Software Solutions
- Model-Based Design Toolbox (MBDT)Model-Based Design Toolbox (MBDT)
- FreeMASTER
- eIQ Machine Learning Software
- Embedded Software and Tools Clinic
- S32 SDK
- S32 Design Studio
- GUI Guider
- Zephyr Project
- Voice Technology
- Application Software Packs
- Secure Provisioning SDK (SPSDK)
- Processor Expert Software
- MCUXpresso Training Hub
-
- Topics
- Mobile Robotics - Drones and RoversMobile Robotics - Drones and Rovers
- NXP Training ContentNXP Training Content
- University ProgramsUniversity Programs
- Rapid IoT
- NXP Designs
- SafeAssure-Community
- OSS Security & Maintenance
- Using Our Community
-
- Cloud Lab Forums
-
- Knowledge Bases
- ARM Microcontrollers
- i.MX Processors
- Identification and Security
- Model-Based Design Toolbox (MBDT)
- QorIQ Processing Platforms
- S32 Automotive Processing Platform
- Wireless Connectivity
- CodeWarrior
- MCUXpresso Suite of Software and Tools
- MQX Software Solutions
-
- Home
- :
- MCUXpresso Software and Tools
- :
- Kinetis Design Studio
- :
- Re: No source available for "__isr_vector() at 0x0"
No source available for "__isr_vector() at 0x0"
- Subscribe to RSS Feed
- Mark Topic as New
- Mark Topic as Read
- Float this Topic for Current User
- Bookmark
- Subscribe
- Mute
- Printer Friendly Page
- Mark as New
- Bookmark
- Subscribe
- Mute
- Subscribe to RSS Feed
- Permalink
- Report Inappropriate Content
Hi to all,
while trying to resolve the problem linked here: Debugging difficult with KDS and breakpoint
I find a very strange problem: many time when I stop with breakpoint and resume execution the debugging cresh and return me this error:
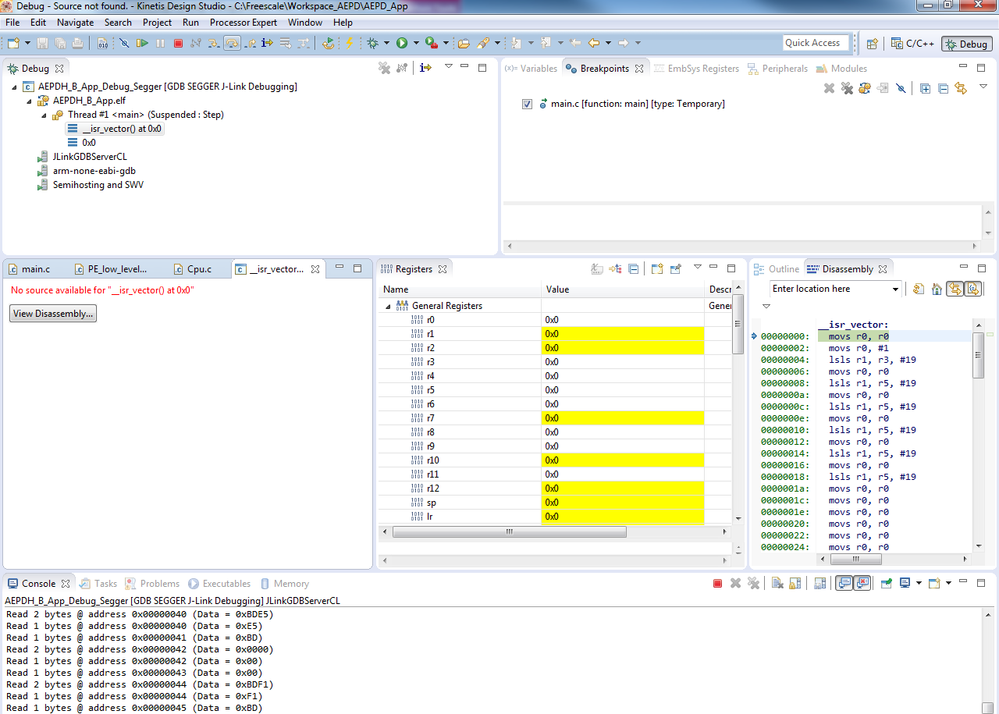
No source available for "__isr_vector() at 0x0"
Now I'm not here to know why my debugger crash (I ask in the previous thred), but I want to know why this error occours.
I'm developing on K20 (and using via PEx KSDK the K60 because there is no KSDK available for K20; FreeScale tech support on field tell me to do this.) with KDS 2.0.0 and KSDK 1.1.0. Debugging via PEMicro Umultilink and all code generated by PEx
I see in my project and I not find reference to isr_vector().
I try to implement Hard Fault of Erich Styeger (Debugging Hard Faults on ARM Cortex-M | MCU on Eclipse) but with no results because I never found vector.c or the reference to interrupt vector generated by PEx; I suppose that the problem is the same: debugger do not find isr_vector
Where I can find the file "Vectors.c" , the routine "_isr_vector()" and how to tell the debugger to search my source code of _isr_vector?
Thanks,
Max
Solved! Go to Solution.
- Mark as New
- Bookmark
- Subscribe
- Mute
- Subscribe to RSS Feed
- Permalink
- Report Inappropriate Content
I recommend: do *not* delete the .metadata folder, because this will delete your workspace settings!
>>No source available for "__isr_vector() at 0x0"
is normal operation of GDB debugger if you have a reset: what happens is that the PC temporarily is at address zero, and from the debug information this is for __isr_vector() (assembly label) where there is no source for it. Perform an assembly step, and you should be fine.
However, your problem is different: it seems that your device does a reset, maybe because of a hardware failure, because of a watchdog reset or because of a bad power supply. Can you check these?
Erich
- Mark as New
- Bookmark
- Subscribe
- Mute
- Subscribe to RSS Feed
- Permalink
- Report Inappropriate Content
Hi Erich,
Many thanks for your answer.
This explain something about: Debugging difficult with KDS and breakpoint
Maybe with my debugger with my custom HW ... The uP reset on a BreakPoint and try to access to _isr_vector()
As soon as I can debug step by step (like discussed in previously linked thred) I try to a step-by-step in assembly.
For a "bad power-supply" you means the power to uP gived from my custom HW or gived from debugger?
Many Thanks,
Massimiliano
- Mark as New
- Bookmark
- Subscribe
- Mute
- Subscribe to RSS Feed
- Permalink
- Report Inappropriate Content
Usually, power is not supplied with the debug probe, so yes, I mean your board/HW power supply.
Erich
- Mark as New
- Bookmark
- Subscribe
- Mute
- Subscribe to RSS Feed
- Permalink
- Report Inappropriate Content
Ok, perfect.
I test with oscilloscope the power supply in many part of that.
I always check the voltage of uP power in and NOT problem were detected. No decrese of voltage, never 1mV...
- Mark as New
- Bookmark
- Subscribe
- Mute
- Subscribe to RSS Feed
- Permalink
- Report Inappropriate Content
I recommend: do *not* delete the .metadata folder, because this will delete your workspace settings!
>>No source available for "__isr_vector() at 0x0"
is normal operation of GDB debugger if you have a reset: what happens is that the PC temporarily is at address zero, and from the debug information this is for __isr_vector() (assembly label) where there is no source for it. Perform an assembly step, and you should be fine.
However, your problem is different: it seems that your device does a reset, maybe because of a hardware failure, because of a watchdog reset or because of a bad power supply. Can you check these?
Erich
- Mark as New
- Bookmark
- Subscribe
- Mute
- Subscribe to RSS Feed
- Permalink
- Report Inappropriate Content
Hi Erich,
i have the same problem:
i don't understand how to "Perform an assembly step" ?
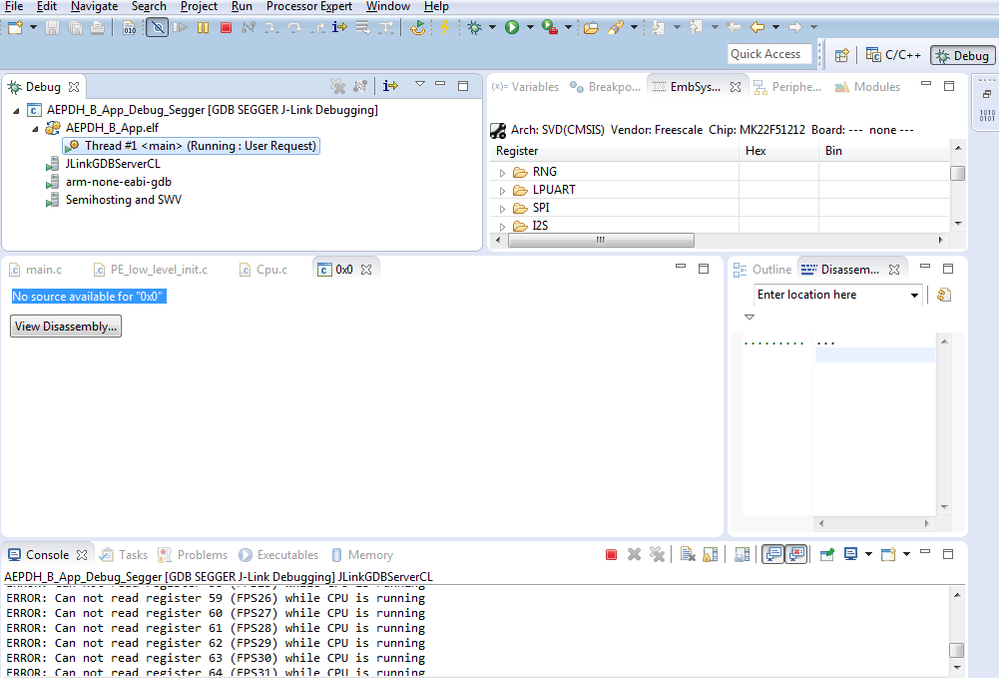
Sometimes it shows "No source available for "0x0" ".
thanks,
JQ
- Mark as New
- Bookmark
- Subscribe
- Mute
- Subscribe to RSS Feed
- Permalink
- Report Inappropriate Content
Hello Max,
The vector.c file is generated by PE project without SDK .
I recommend you delete the ".metadata" file under workspace ,then try again.
BR
Alice

