- Forums
- Product Forums
- General Purpose MicrocontrollersGeneral Purpose Microcontrollers
- i.MX Forumsi.MX Forums
- QorIQ Processing PlatformsQorIQ Processing Platforms
- Identification and SecurityIdentification and Security
- Power ManagementPower Management
- MCX Microcontrollers
- S32G
- S32K
- S32V
- MPC5xxx
- Other NXP Products
- Wireless Connectivity
- S12 / MagniV Microcontrollers
- Powertrain and Electrification Analog Drivers
- Sensors
- Vybrid Processors
- Digital Signal Controllers
- 8-bit Microcontrollers
- ColdFire/68K Microcontrollers and Processors
- PowerQUICC Processors
- OSBDM and TBDML
-
- Solution Forums
- Software Forums
- MCUXpresso Software and ToolsMCUXpresso Software and Tools
- CodeWarriorCodeWarrior
- MQX Software SolutionsMQX Software Solutions
- Model-Based Design Toolbox (MBDT)Model-Based Design Toolbox (MBDT)
- FreeMASTER
- eIQ Machine Learning Software
- Embedded Software and Tools Clinic
- S32 SDK
- S32 Design Studio
- GUI Guider
- Zephyr Project
- Voice Technology
- Application Software Packs
- Secure Provisioning SDK (SPSDK)
- Processor Expert Software
- MCUXpresso Training Hub
-
- Topics
- Mobile Robotics - Drones and RoversMobile Robotics - Drones and Rovers
- NXP Training ContentNXP Training Content
- University ProgramsUniversity Programs
- Rapid IoT
- NXP Designs
- SafeAssure-Community
- OSS Security & Maintenance
- Using Our Community
-
- Cloud Lab Forums
-
- Knowledge Bases
- ARM Microcontrollers
- i.MX Processors
- Identification and Security
- Model-Based Design Toolbox (MBDT)
- QorIQ Processing Platforms
- S32 Automotive Processing Platform
- Wireless Connectivity
- CodeWarrior
- MCUXpresso Suite of Software and Tools
- MQX Software Solutions
-
- RSS フィードを購読する
- トピックを新着としてマーク
- トピックを既読としてマーク
- このトピックを現在のユーザーにフロートします
- ブックマーク
- 購読
- ミュート
- 印刷用ページ
- 新着としてマーク
- ブックマーク
- 購読
- ミュート
- RSS フィードを購読する
- ハイライト
- 印刷
- 不適切なコンテンツを報告
- Question 1
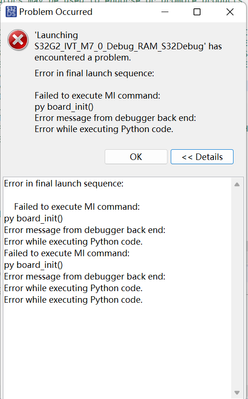
Since in my environment, the M7_0 bootloader doesn't seem to work properly in QSPI mode, I want to debug it with S32G Debug Probe and S32G Design Studio,but when I was applied the configuration and click the [debug], it seems that the debugger work abnormal and information as blow:
for the Env.
S32G DS 3.4.3
bootloader config with EB and build with cygwin
debugger configurations as blow
python2.7
- Question 2
Also I want to loader the elf file with command mode as
HOWTO: Command Line GDB Debugging with S32 Debug P... - NXP Community
but when I user the gdb source command, the "Undefined command: "import". Try "help"." occured.
- Question 3
just refer to HOWTO: Command Line GDB Debugging with S32 Debug P... - NXP Community
there are some messages like blow:
Configure the JTAG. The S32G274A evaluation board supports both 10- and 20- pin JTAG connections. The default board configuration is set to 20-pin, change the position of the jumper J59 from 2-3(default) to 1-2, if you are using the 10 Pin JTAG interface. Both are supported by the S32 Debugger and S32 Debug Probe.
But I can't find the J59 in my S32G-VNP-RDB2 board, is it ncessary?
Maybe, the qeustion1 and question2 are same reason.....
解決済! 解決策の投稿を見る。
- 新着としてマーク
- ブックマーク
- 購読
- ミュート
- RSS フィードを購読する
- ハイライト
- 印刷
- 不適切なコンテンツを報告
Hi,
For Q1 & Q2:
Have you verified that you can debug with an NXP provided example?
We do recommend starting with an example provided by NXP, for you to verify you can debug an application. This may solve some questions that are in the air about the debug process and image loading.
For Q3:
This guide was developed for the EVB platform in mind, not the RDB.
RDB uses 20-pin JTAG only for debugging S32G. The other 10-pin connector is for SJA1110, not S32G.
Please, let us know.
- 新着としてマーク
- ブックマーク
- 購読
- ミュート
- RSS フィードを購読する
- ハイライト
- 印刷
- 不適切なコンテンツを報告
- Have you verified that you can debug with an NXP provided example?
No I didn't, But when I recreated the debug Env. in Ubuntu 18.04, it worked normally.
- 新着としてマーク
- ブックマーク
- 購読
- ミュート
- RSS フィードを購読する
- ハイライト
- 印刷
- 不適切なコンテンツを報告
I see. Thank you for your explanation


