
- Forums
- Product Forums
- General Purpose MicrocontrollersGeneral Purpose Microcontrollers
- i.MX Forumsi.MX Forums
- QorIQ Processing PlatformsQorIQ Processing Platforms
- Identification and SecurityIdentification and Security
- Power ManagementPower Management
- MCX Microcontrollers
- S32G
- S32K
- S32V
- MPC5xxx
- Other NXP Products
- Wireless Connectivity
- S12 / MagniV Microcontrollers
- Powertrain and Electrification Analog Drivers
- Sensors
- Vybrid Processors
- Digital Signal Controllers
- 8-bit Microcontrollers
- ColdFire/68K Microcontrollers and Processors
- PowerQUICC Processors
- OSBDM and TBDML
-
- Solution Forums
- Software Forums
- MCUXpresso Software and ToolsMCUXpresso Software and Tools
- CodeWarriorCodeWarrior
- MQX Software SolutionsMQX Software Solutions
- Model-Based Design Toolbox (MBDT)Model-Based Design Toolbox (MBDT)
- FreeMASTER
- eIQ Machine Learning Software
- Embedded Software and Tools Clinic
- S32 SDK
- S32 Design Studio
- GUI Guider
- Zephyr Project
- Voice Technology
- Application Software Packs
- Secure Provisioning SDK (SPSDK)
- Processor Expert Software
- MCUXpresso Training Hub
-
- Topics
- Mobile Robotics - Drones and RoversMobile Robotics - Drones and Rovers
- NXP Training ContentNXP Training Content
- University ProgramsUniversity Programs
- Rapid IoT
- NXP Designs
- SafeAssure-Community
- OSS Security & Maintenance
- Using Our Community
-
- Cloud Lab Forums
-
- Knowledge Bases
- ARM Microcontrollers
- i.MX Processors
- Identification and Security
- Model-Based Design Toolbox (MBDT)
- QorIQ Processing Platforms
- S32 Automotive Processing Platform
- Wireless Connectivity
- CodeWarrior
- MCUXpresso Suite of Software and Tools
- MQX Software Solutions
-
- Home
- :
- MCUXpresso软件和工具
- :
- MCUXpresso IDE
- :
- MCUXpresso and J-Link debugger
MCUXpresso and J-Link debugger
MCUXpresso and J-Link debugger
Dear NXP,
I am having trouble debugging with the J-link debugger using the MCUXpresso.
Please note that when I am using the old Kinetis Design Studio it is working OK.
Processor: MKL17Z644
MCUXpresso version: 10.0.2
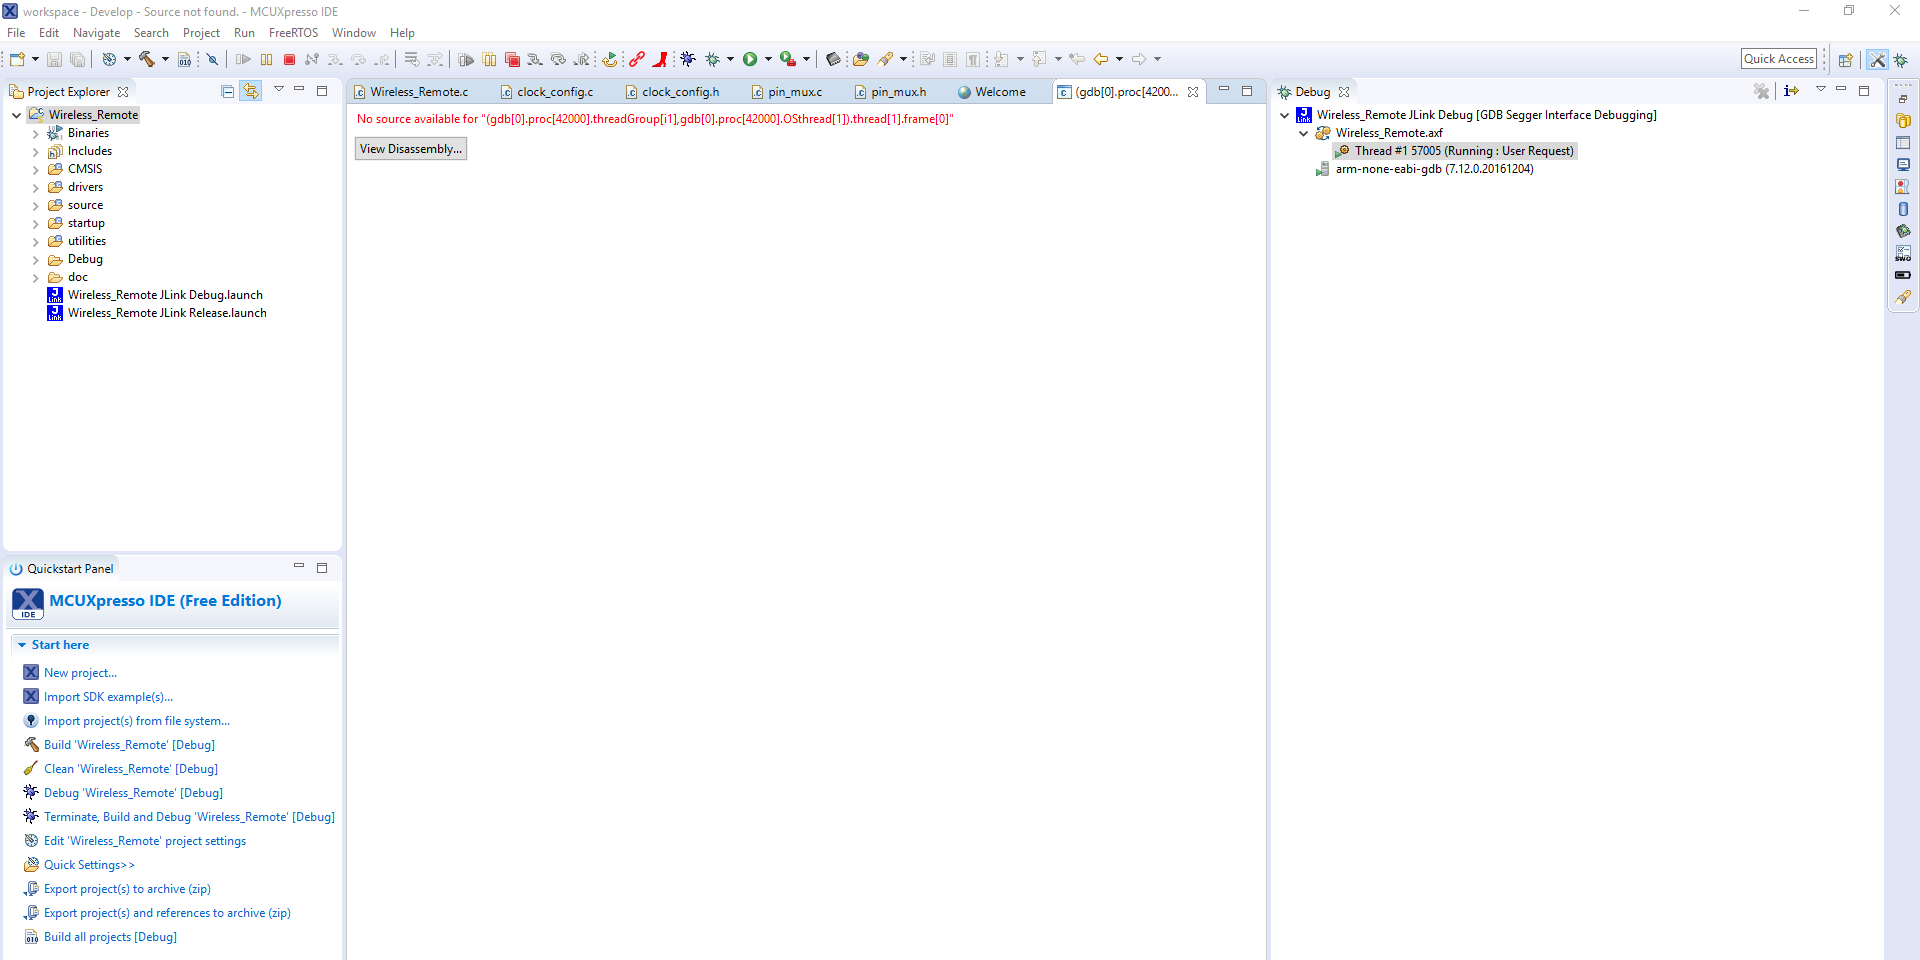
When I am creating a new debug configuration (using the quickstart panel) I am getting the following message:
"No source available for "(gdb[0].proc[42000].threadGroup[i1],gdb[0].proc[42000].OSthread[1]).thread[1].frame[0]"
Please refer to the attached file
Thanks in advance
Erez.
Is this happening with a standard example for your MCU, or only with your own project? And is it a standard board or your own?
I presume that you never hit the default breakpoint on main()? But what happens if you hit the pause button in the IDE?
Can you also confirm what version of SEGGER software you are using? As you are having problems, it may be worth installing the latest version (available from the SEGGER website) and seeing if you still see the same problem.
Finally, can you post the text from the SEGGER console in the Console View (as per section 14.11 - The Console View - and section 3.10 - SEGGER Troubleshooting - of the MCUXpresso IDE v10.0.2 User Guide).
[ Aside : with regards to the gdb[0]... editor tab that you are seeing, this message is generally erroneous. The debugger has at some point during the connection to the target tried to access memory at a point when the PC was not "valid", and then tried to display the source related to the "invalid" address - which has triggered the edit box with the"no source..." message in it. Preventing this happening is actually very hard, as it depends on all sorts of configuration and timings between the PC, the debug probe and the target. And many users won't actually see it in their particular setup. ]
Regards,
MCUXpresso IDE Support