- Forums
- Product Forums
- General Purpose MicrocontrollersGeneral Purpose Microcontrollers
- i.MX Forumsi.MX Forums
- QorIQ Processing PlatformsQorIQ Processing Platforms
- Identification and SecurityIdentification and Security
- Power ManagementPower Management
- MCX Microcontrollers
- S32G
- S32K
- S32V
- MPC5xxx
- Other NXP Products
- Wireless Connectivity
- S12 / MagniV Microcontrollers
- Powertrain and Electrification Analog Drivers
- Sensors
- Vybrid Processors
- Digital Signal Controllers
- 8-bit Microcontrollers
- ColdFire/68K Microcontrollers and Processors
- PowerQUICC Processors
- OSBDM and TBDML
-
- Solution Forums
- Software Forums
- MCUXpresso Software and ToolsMCUXpresso Software and Tools
- CodeWarriorCodeWarrior
- MQX Software SolutionsMQX Software Solutions
- Model-Based Design Toolbox (MBDT)Model-Based Design Toolbox (MBDT)
- FreeMASTER
- eIQ Machine Learning Software
- Embedded Software and Tools Clinic
- S32 SDK
- S32 Design Studio
- GUI Guider
- Zephyr Project
- Voice Technology
- Application Software Packs
- Secure Provisioning SDK (SPSDK)
- Processor Expert Software
- MCUXpresso Training Hub
-
- Topics
- Mobile Robotics - Drones and RoversMobile Robotics - Drones and Rovers
- NXP Training ContentNXP Training Content
- University ProgramsUniversity Programs
- Rapid IoT
- NXP Designs
- SafeAssure-Community
- OSS Security & Maintenance
- Using Our Community
-
- Cloud Lab Forums
-
- Knowledge Bases
- ARM Microcontrollers
- i.MX Processors
- Identification and Security
- Model-Based Design Toolbox (MBDT)
- QorIQ Processing Platforms
- S32 Automotive Processing Platform
- Wireless Connectivity
- CodeWarrior
- MCUXpresso Suite of Software and Tools
- MQX Software Solutions
-
- Home
- :
- MCUXpresso软件和工具
- :
- MCUXpresso IDE
- :
- MCUX 11.0.1 - Debugger randomly fails with "error in final launch sequence"
MCUX 11.0.1 - Debugger randomly fails with "error in final launch sequence"
MCUX 11.0.1 - Debugger randomly fails with "error in final launch sequence"
Subject basically says it all. I'm using a SEGGER J-Link Pro on a custom RT1052 board (though I've also had this happen when connected with the J-Link to my RT1052 EVKB). My target has been freshly reset, and MCUX has either been running for a little bit, or has been freshly restarted (I've had both fail on me). I click the green bug to start my debug session, the SEGGER flash window comes up, compares the contents, they match so there's no programming to do, the IDE starts going through its usual "initializing the debug session" mechanics, then this error dialog pops up:
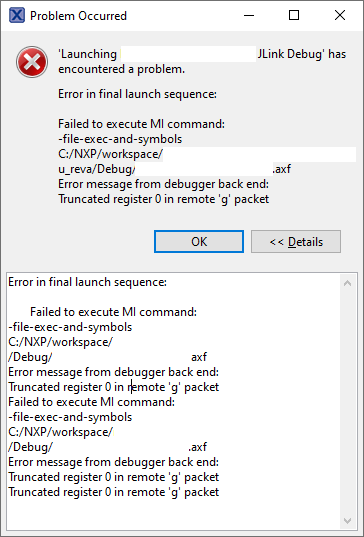
Error in final launch sequence:
Failed to execute MI command:
-file-exec-and-symbols C:/NXP/workspace/[redacted]/Debug/[redacted].axf
Error message from debugger back end:
Truncated register 0 in remote 'g' packet
Failed to execute MI command:
-file-exec-and-symbols C:/NXP/workspace/[redacted]/Debug/[redacted].axf
Error message from debugger back end:
Truncated register 0 in remote 'g' packet
Truncated register 0 in remote 'g' packetOr hey, after deleting my breakpoints and trying again, I get a different message:
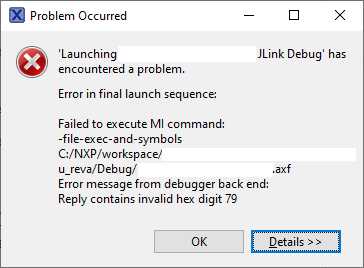
Error in final launch sequence:
Failed to execute MI command:
-file-exec-and-symbols C:/NXP/workspace/[redacted]/Debug/[redacted].axf
Error message from debugger back end:
Reply contains invalid hex digit 79
Failed to execute MI command:
-file-exec-and-symbols C:/NXP/workspace/[redacted]/Debug/[redacted].axf
Error message from debugger back end:
Reply contains invalid hex digit 79
Reply contains invalid hex digit 79This issue is not unique to MCUX 11.0.1; I've been experiencing this type of failure randomly ever since I started work on the RT1050 platform. There doesn't appear to be a 100% reliable way to prevent the issue from occurring the next time I try to launch a debug session; I just have to pray that I don't waste another 20-30 seconds launching a debug session that fails before I have a chance to reach main().
And yes, sometimes the debug session launches just fine (so my debug pod and hardware are intact). Sometimes killing and restarting MCUX seems to fix things, but not always. It's just incredibly frustrating to have such a core feature be so unreliable.
David R.
In my build system I create a command file for gdb to advance to the first instruction in flash/after the ROM bootloader (i.e., the start of ResetISR), e.g., "adv *0x60002314". In a similar random fashion as described in this thread, gdb is sometimes unable to do that but the amazing thing is that the error message points to the wrong cause:
example.gdbinit:1: Error in sourced command file:
Invalid hex digit 79
There is no 0x79 in there at all. There is probably some kind of bug in gdb leading to this erroneous message where it mixes up the location but I am 99% sure it's the same cause. I am using target extended-remote mode with a pipe to start crt_emu_cm_redlink but there are some other commands executed before the advance command in the gdbinit file.
It's also very, very seldom that I get it. What's happening more often - in the same circumstance and also randomly - is this:
Note: automatically using hardware breakpoints for read-only addresses.
Warning:
Cannot insert breakpoint 0.
Cannot access memory at address 0xfffffffd
example.gdbinit:1: Error in sourced command file:
Command aborted.
In that case the execution actually works just fine if I simply continue. I cannot reproduce either of these deterministically. It's impossible for me to tell the underlying cause(s) but I'd rather expect the debugger firmware or the gdb-server code to be the culprit than a hardware fluke.
Have you found any possible solutions to this problem? I have the same board and the same problem
Can you check if your "target interface" is set as SWD or JTAG?
On our side, with SWD is normally working.
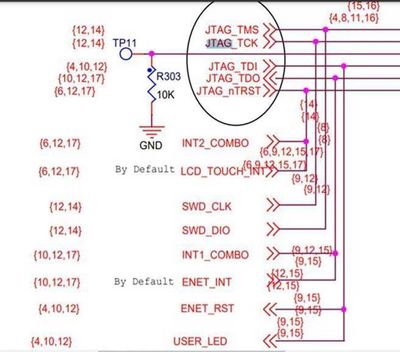
On JTAG, JTAG pins are connected as well to other signals that can have an impact on this functionality - so maybe it might explain the behavior:
Regards,
MCUXpresso IDE Support
I'm working with SWD. I am developing a project with lvgl, when adding many images (gift) I have the error, removing them the error disappears
Hi David,
me too, I have seeing this sporadically and I have not been able to reproduce it in a clear way.
What seemed to help reducing it at least for the EVK was making sure the power supply extremely solid and good. The power domains of the RT seem to be kind of sensitive. The other thing was reducing the SWD/JTAG cable length and location of the cable. It seems to me that the high frequencies might have an impact. It did not completely remove it, but at least it seemed to me it was better that way.
I hope this helps,
Erich
What spurred me to finally write my post last night was that I hit a patch where four or five consecutive debug attempts failed. It seemed that if I kept re-launching without any changes, the same debug failure would occur. I tried deleting my pre-existing breakpoints and launching, and that got me the second form of failure you see above. Actually, based on my notes, I only ever see one of two "error message from debugger back end":
- Truncated register 0 in remote 'g' packet
- Reply contains invalid hex digit 79
It's kinda worrying that the RT1050 seems so twitchy with respect to its power supply. As for cabling, I'm using the standard 20-pin 100-mil-pitch 6" ribbon cable that came with the SEGGER J-Link (we have a 20-pin standard ARM header on our board, identical to the EVKB). One thing I did last night was disable the FreeRTOS plug-in; that at least allowed me to reach main() in the debugger and start debugging. My working theory is that disabling the plug-in reduced the workload of the debugger, and thus gave it fewer steps to potentially screw up. I'm not convinced this is 100% a hardware/environment-related failure; this still feels like it could be some type of debugger software failure, but I have nothing to base that on.
Anyway, maybe more people can chime in if they've also encountered this error message; it's at least encouraging that you've seen this also, and that I'm not the only one. (Starting to feel like an "RT1050 Users Support Group"....)
David R.


