- Forums
- Product Forums
- General Purpose MicrocontrollersGeneral Purpose Microcontrollers
- i.MX Forumsi.MX Forums
- QorIQ Processing PlatformsQorIQ Processing Platforms
- Identification and SecurityIdentification and Security
- Power ManagementPower Management
- Wireless ConnectivityWireless Connectivity
- RFID / NFCRFID / NFC
- Advanced AnalogAdvanced Analog
- MCX Microcontrollers
- S32G
- S32K
- S32V
- MPC5xxx
- Other NXP Products
- S12 / MagniV Microcontrollers
- Powertrain and Electrification Analog Drivers
- Sensors
- Vybrid Processors
- Digital Signal Controllers
- 8-bit Microcontrollers
- ColdFire/68K Microcontrollers and Processors
- PowerQUICC Processors
- OSBDM and TBDML
- S32M
- S32Z/E
-
- Solution Forums
- Software Forums
- MCUXpresso Software and ToolsMCUXpresso Software and Tools
- CodeWarriorCodeWarrior
- MQX Software SolutionsMQX Software Solutions
- Model-Based Design Toolbox (MBDT)Model-Based Design Toolbox (MBDT)
- FreeMASTER
- eIQ Machine Learning Software
- Embedded Software and Tools Clinic
- S32 SDK
- S32 Design Studio
- GUI Guider
- Zephyr Project
- Voice Technology
- Application Software Packs
- Secure Provisioning SDK (SPSDK)
- Processor Expert Software
- Generative AI & LLMs
-
- Topics
- Mobile Robotics - Drones and RoversMobile Robotics - Drones and Rovers
- NXP Training ContentNXP Training Content
- University ProgramsUniversity Programs
- Rapid IoT
- NXP Designs
- SafeAssure-Community
- OSS Security & Maintenance
- Using Our Community
-
- Cloud Lab Forums
-
- Knowledge Bases
- ARM Microcontrollers
- i.MX Processors
- Identification and Security
- Model-Based Design Toolbox (MBDT)
- QorIQ Processing Platforms
- S32 Automotive Processing Platform
- Wireless Connectivity
- CodeWarrior
- MCUXpresso Suite of Software and Tools
- MQX Software Solutions
- RFID / NFC
- Advanced Analog
-
- NXP Tech Blogs
- Home
- :
- General Purpose Microcontrollers
- :
- Kinetis Microcontrollers
- :
- Problem launching debug session in MCUXpresso
Problem launching debug session in MCUXpresso
- Subscribe to RSS Feed
- Mark Topic as New
- Mark Topic as Read
- Float this Topic for Current User
- Bookmark
- Subscribe
- Mute
- Printer Friendly Page
- Mark as New
- Bookmark
- Subscribe
- Mute
- Subscribe to RSS Feed
- Permalink
- Report Inappropriate Content
Hi,
I have a project for MK10DN512VLL10 and have to the best of my knowledge properly configured Debug settings (with Device type: MK10DN512VLL10, Segger J-Link SWD debugger, etc.) in my MCUXpresso IDE v11.4.0 [Build 6224] [2021-07-15].
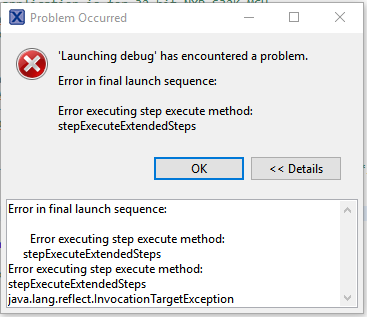
However, when I start the debugger the following window pops up:
The details debug log is attached.
Using the Segger's J-Flash I can flash the binary to MCU, but not using the MCUXpresso.
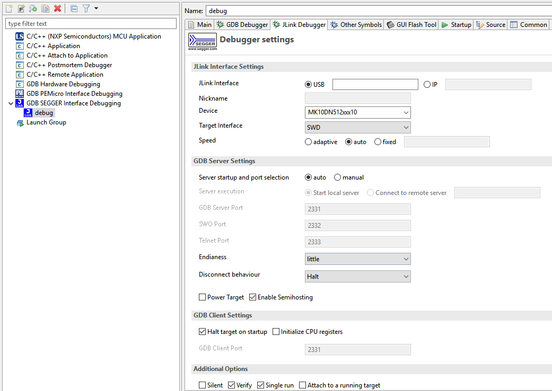
The JLink debugger page in Debug Configuration looks like the following:
Could NXP support help to resolve the problem?
Thanks a lot for any help.
Solved! Go to Solution.
- Mark as New
- Bookmark
- Subscribe
- Mute
- Subscribe to RSS Feed
- Permalink
- Report Inappropriate Content
A resolution was to export the debugging settings from a working sample project into a *.launch file and to import it back again to the project of interest with some minor changes like project and binary names.
- Mark as New
- Bookmark
- Subscribe
- Mute
- Subscribe to RSS Feed
- Permalink
- Report Inappropriate Content
I'm not sure, but I think something might be missing in your manual launch configuration. I suggest that you create a project from/with the SDK and try debugging it: this shall work. And then you can compare your manual launch configuration with the generated one.
I hope this helps,
Erich
- Mark as New
- Bookmark
- Subscribe
- Mute
- Subscribe to RSS Feed
- Permalink
- Report Inappropriate Content
When I create a sample project i can, in principle, start the debugger using the blue button. It works.
I have created a new project of type "Makefile project with existing code" and using the green button have configured my project similar to the one in the sample project. The project is still built externally.
I have read in other forum thread that in MCUXpresso one should not use the green button for debugging. However, when i press the blue button recognizes the Segger JLink probe but then shows "No binaries found in 'Project'".
Does this mean that the path to the binary specified in the Debug Configuration window (via the green button) is not seen by the blue button? How should one make the path to the binary available to the blue button?
- Mark as New
- Bookmark
- Subscribe
- Mute
- Subscribe to RSS Feed
- Permalink
- Report Inappropriate Content
A resolution was to export the debugging settings from a working sample project into a *.launch file and to import it back again to the project of interest with some minor changes like project and binary names.
- Mark as New
- Bookmark
- Subscribe
- Mute
- Subscribe to RSS Feed
- Permalink
- Report Inappropriate Content
Did you create your launch configuration 'manually'?
Have you downloaded and installed the SDK for the MK10 from https://mcuxpresso.nxp.com already? Because with the SDK project the 'blue' debug button will create the correct launch configuration for you.
I hope this helps,
Erich
- Mark as New
- Bookmark
- Subscribe
- Mute
- Subscribe to RSS Feed
- Permalink
- Report Inappropriate Content
Thanks a lot for the response.
Yes, i created the debug settings manually. I have a custom project with makefile to build the executable so, basically, i use command line to build the project and want to debug it afterwards by creating a debug configuration. This worked without problem in S32 Design Studio of NXP but for some reason issues an error in MCUXpresso.
The SDK v2.2.0 is installed, however, the blue button only shows me the available J-Link probe without doing anything else.

