- Forums
- Product Forums
- General Purpose MicrocontrollersGeneral Purpose Microcontrollers
- i.MX Forumsi.MX Forums
- QorIQ Processing PlatformsQorIQ Processing Platforms
- Identification and SecurityIdentification and Security
- Power ManagementPower Management
- Wireless ConnectivityWireless Connectivity
- RFID / NFCRFID / NFC
- Advanced AnalogAdvanced Analog
- MCX Microcontrollers
- S32G
- S32K
- S32V
- MPC5xxx
- Other NXP Products
- S12 / MagniV Microcontrollers
- Powertrain and Electrification Analog Drivers
- Sensors
- Vybrid Processors
- Digital Signal Controllers
- 8-bit Microcontrollers
- ColdFire/68K Microcontrollers and Processors
- PowerQUICC Processors
- OSBDM and TBDML
- S32M
- S32Z/E
-
- Solution Forums
- Software Forums
- MCUXpresso Software and ToolsMCUXpresso Software and Tools
- CodeWarriorCodeWarrior
- MQX Software SolutionsMQX Software Solutions
- Model-Based Design Toolbox (MBDT)Model-Based Design Toolbox (MBDT)
- FreeMASTER
- eIQ Machine Learning Software
- Embedded Software and Tools Clinic
- S32 SDK
- S32 Design Studio
- GUI Guider
- Zephyr Project
- Voice Technology
- Application Software Packs
- Secure Provisioning SDK (SPSDK)
- Processor Expert Software
- Generative AI & LLMs
-
- Topics
- Mobile Robotics - Drones and RoversMobile Robotics - Drones and Rovers
- NXP Training ContentNXP Training Content
- University ProgramsUniversity Programs
- Rapid IoT
- NXP Designs
- SafeAssure-Community
- OSS Security & Maintenance
- Using Our Community
-
- Cloud Lab Forums
-
- Knowledge Bases
- ARM Microcontrollers
- i.MX Processors
- Identification and Security
- Model-Based Design Toolbox (MBDT)
- QorIQ Processing Platforms
- S32 Automotive Processing Platform
- Wireless Connectivity
- CodeWarrior
- MCUXpresso Suite of Software and Tools
- MQX Software Solutions
- RFID / NFC
- Advanced Analog
-
- NXP Tech Blogs
- Home
- :
- MCUXpresso Software and Tools
- :
- Kinetis Design Studio Knowledge Base
- :
- GDB Debugging with Kinetis Design Studio
GDB Debugging with Kinetis Design Studio
- Subscribe to RSS Feed
- Mark as New
- Mark as Read
- Bookmark
- Subscribe
- Printer Friendly Page
- Report Inappropriate Content
GDB Debugging with Kinetis Design Studio
GDB Debugging with Kinetis Design Studio
Outline
How to start debugging with the GDB debugging in KDS. If you are coming from CodeWarrior, then debugging with KDS is somewhat different because of the nature of GDB, and because the debug configuration panels look different.
This document uses
- FRDM-K64F board (Freescale Freedom Development Platform)
- Kinetis Design Studio V1.1.0.(Kinetis Design Studio Integrated Development)
- Screenshots from Windows 7 host (but things are very similar to any other host supported)
Creating Debug Configuration
In order to debug, a debug configuration needs to be created. It is assumed that you already have compiled/linked your project at this time.
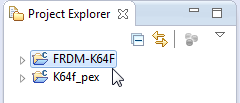
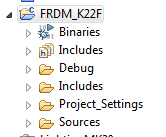
In order to have most fields of the debug configuration pre-populated, select the project in the Project Explorer view:
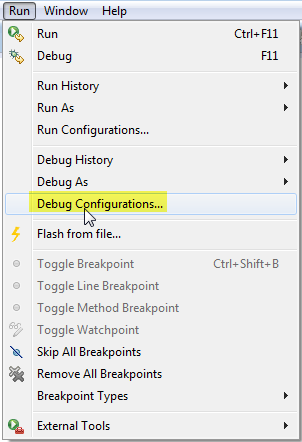
Select the menu Run > Debug Configuration:
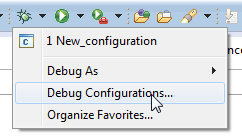
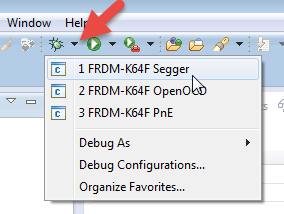
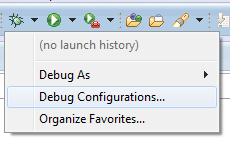
Alternatively, the debug icon drop down list can be used:
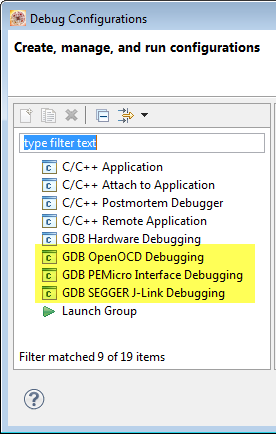
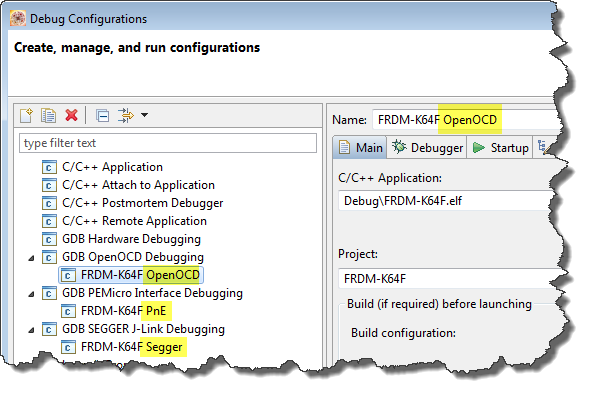
Kinetis Design Studio supports three different debugging connections:
- GDB OpenOCD Debugging: this uses the OpenOCD to CMSIS-DAP debug protocol, available with OpenSDAv2.0 (FRDM-K64F) or OpenSDAv2.1 (FRDM-K22F)
- GDB PEMicro Interface Debugging: this can be used for any P&E device (Multilink, or OSJAT/OpenSDA P&E firmware on a Freescale board)
- GDB SEGGER J-Link Debugging: this can be used with any Segger device (J-Link, or OpenSDA J-Link firmware on a Freescale board)
Once the configuration is created, I recommend to name it according t
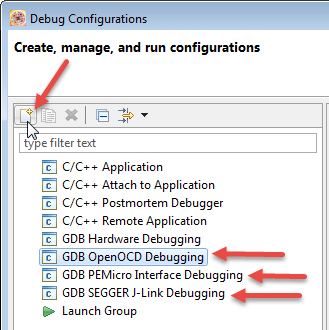
Double click on one of the entries to create a new configuration for it. Instead double clicking you can use the 'New' icon as well:
What I recommend is to name the debug configuration. So I know later which configuration is for what. What I'm using is <project name><connection> like below:
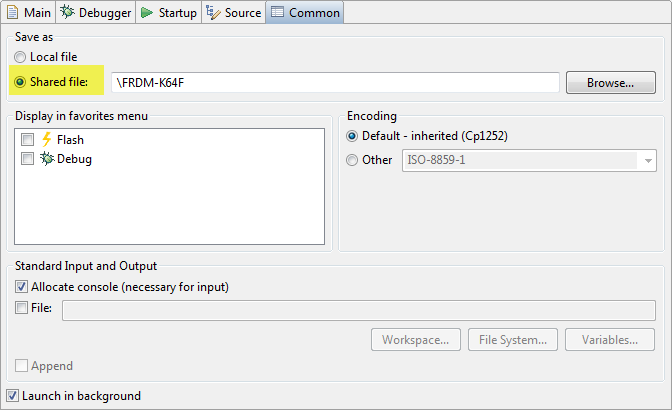
Another thing I highly recommend is to save the debug configuration as file in the project (.launch). This allows sharing or passing the debug configuration with the project files.
To do this, I have 'Shared file' enabled:
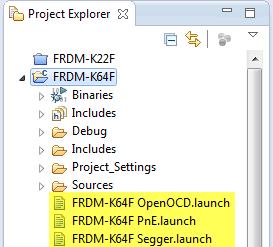
That way the launch configuration files are stored in the project:
Then I need to fill out the fields for the debug configuration.
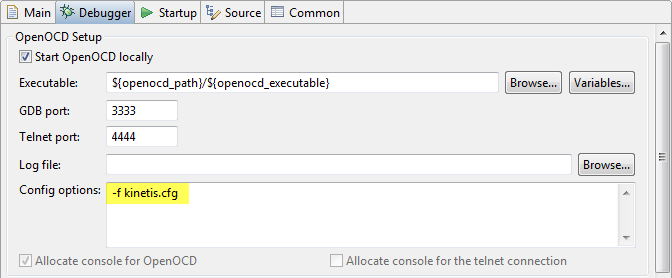
The details are listed in DS Debug Configurations (OpenOCD, P&E, Segger), and listed here again:
For OpenOCD, use "-f kinetis.cfg" which is the same for all Kinetis devices:
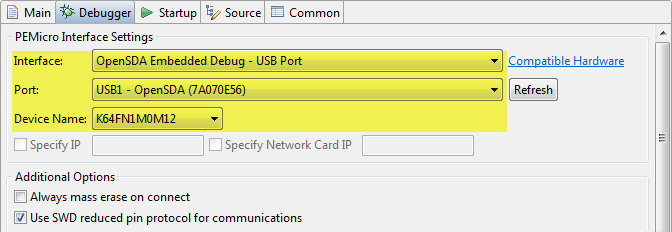
For P&E: select the interface, port and device:
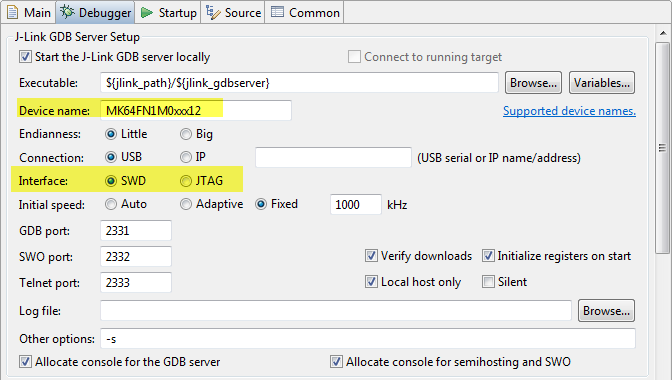
For Segger, specify device name, interface (use JTAG only if you know the debug header supports JTAG. If in doubt, choose SWD):
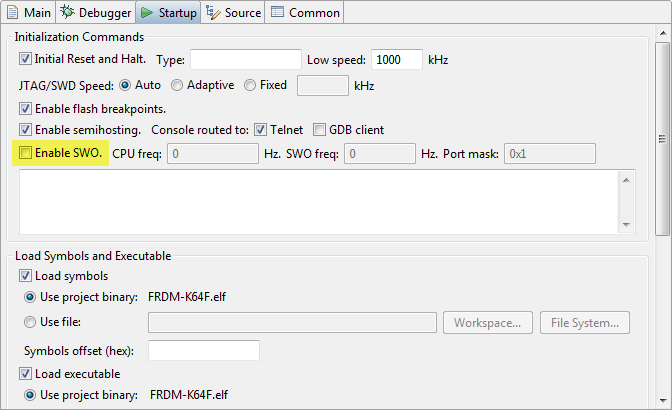
SWO (Single Wire Output) is an extra pin to SWD/JTAG, and currently not supported on FRDM boards. So I disable that option for my FRDM boards, as otherwise the debugger will complain later about it:
Debugging and Debug Icon
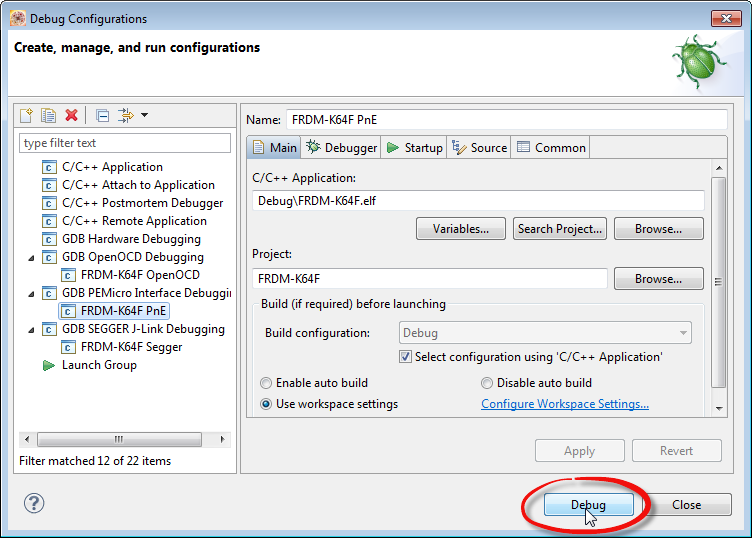
To Debug, one way is to use the 'Debug' button from the Debug Configuration dialog:
You have to do this at least once.
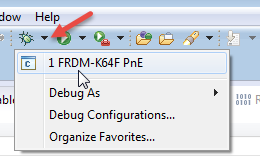
Once you have done that, then you can use the drop down of the Debug icon:
Just pressing the 'Debug' Icon is in general NOT recommended if it does not show in the tooltip a launch configuration:
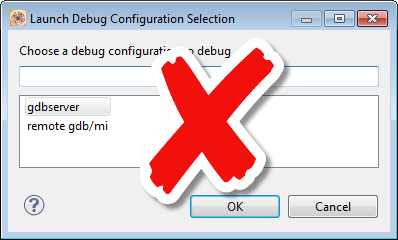
And if you get the dialog below:
DO NOT select either gdbserver or remote gdb/mi: it does not work that way :-(
Press Cancel, and select it from the list, or select it from the 'Debug Configurations...' dialog:
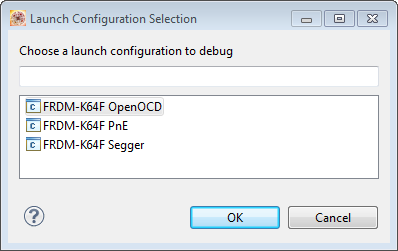
Although KDS V1.1.0 has improved in this area, it is possible that it will show you a selection of launch/debug configurations (then you are ok to choose one):
The recommended way is to use the drop down list and to select the desired debug/launch configuration:
Trouble Shooting
If debugging does not work, here are a few trouble shooting tips:
Settings: verify that your launch configuration settiings are ok. That you are debugging the correct board with the correct connection (P&E, OpenOCD, Segger).
Power: Verify that your board has power and connected with the correct USB port on the board.
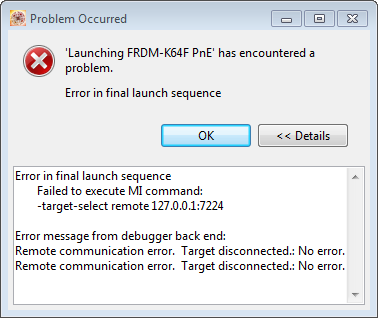
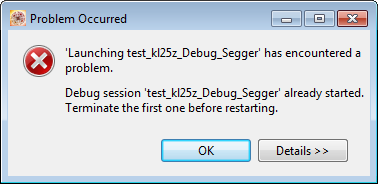
Not Debugging Twice: Make sure that you are *not* debugging the same application board twice, or you will get this:
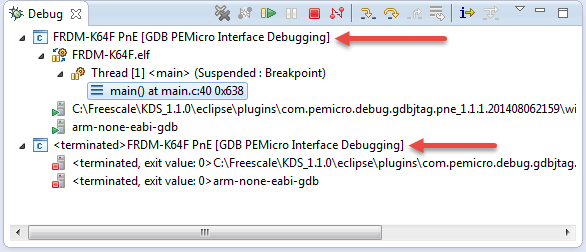
Because the board is already running a debug session:
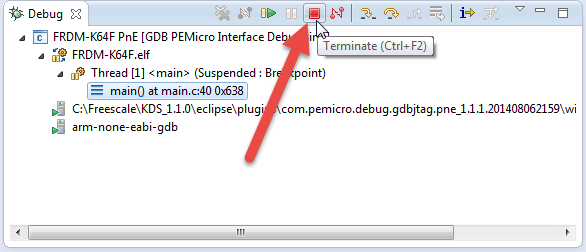
Always terminate an existing debug session before starting a new one:
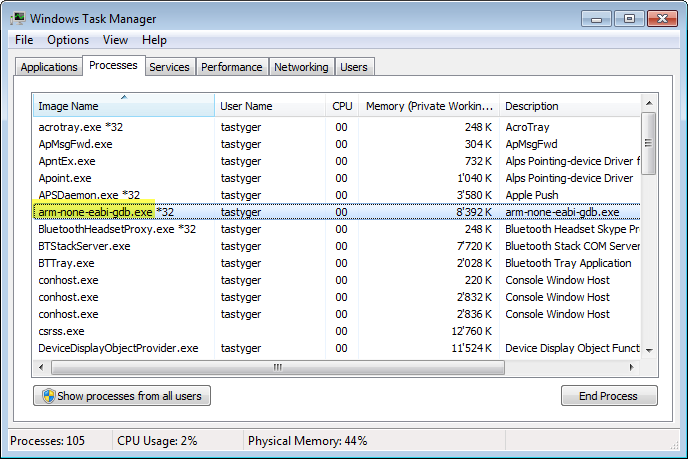
Kill any Zombies: the gdb client and server are usually terminated after a debug session. After terminating a debug session, verify that these services are *not* present any more in your task manager (Windows):
- arm-none-eabi-gdb.exe: this is the ARM GDB client, needed for the OpenOCD, Segger and P&E servers listed below
- openocd.exe: this is the OpenOCD GDB server
- pegdbserver_console.exe: this is the P&E GDB Server
- JLinkGDBServerCL.exe: this is the Segger GDB Server
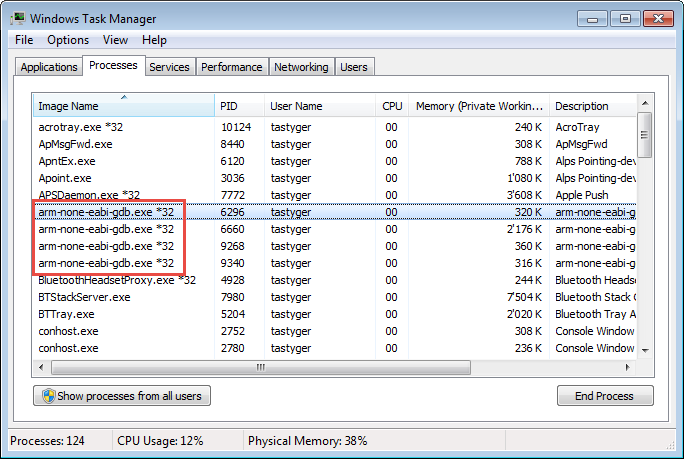
If you see multiple zombies/instances like this: kill them:
Links
- Mark as Read
- Mark as New
- Bookmark
- Permalink
- Report Inappropriate Content
I just thought it might be useful to describe the above process as applied to creating a GDB launcher for a USBDM debug interface.
USBDM: USBDM Debugger interface for Freescale RS08,HCS08,HCS12,Coldfire and ARM-Kinetis Devices.
Note that this process is not necessary if you create a project using the USBDM new project wizard.
Assumes the following:
- KDS
- USBDM installed after KDS so that the required plugins are installed.
- A FRDM-K22F board with USBDM firmware.
- An existing project without any current launch configuration (the usual situation if a project has just been created)
- Select the project in the Project Explorer and make sure that it has been successfully built.
- Open the drop-down next to the debug button and select Debug Configurations:
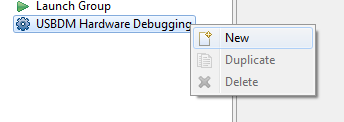
- Select the USBDM Hardware Debugging group and select new from the right-click menu or the new icon at the top of the dialogue.
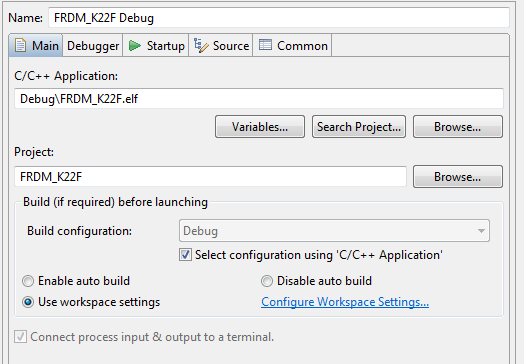
- The dialogue that open is similar to a standard Eclipse Launch configuration. The first page should be correctly fill out providing an existing correctly built project was selected earlier. You can use the browse button to select other build targets if desired. IN the example shown the Debug build was currently selected in the build target (project selected).
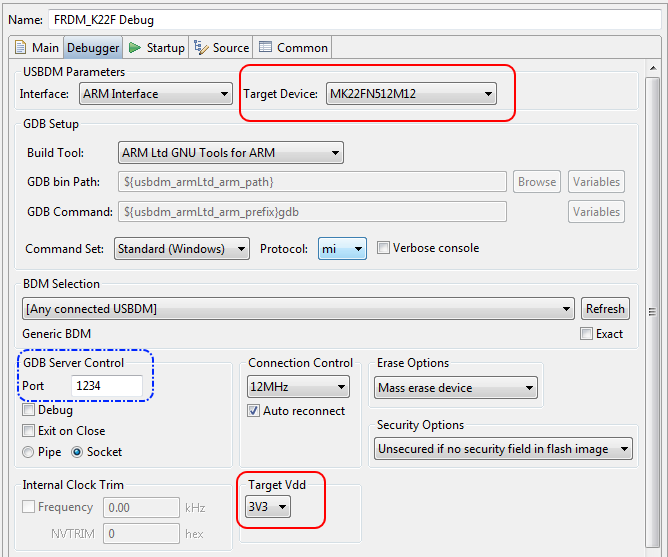
- The second tab will usually need modification The most important items are the Target Device selection and the target Vdd (only needed for targets with switchable target power such as K22F). You can also the change the socket used by GDB if desired. This may be needed if you want to debug multiple targets using two instances of KDS.
- You should now be able to launch the configuration using the Launch button.
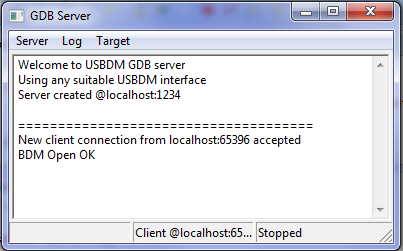
- The USBDM GDB Server will be started as a separate process with its own GUI window:
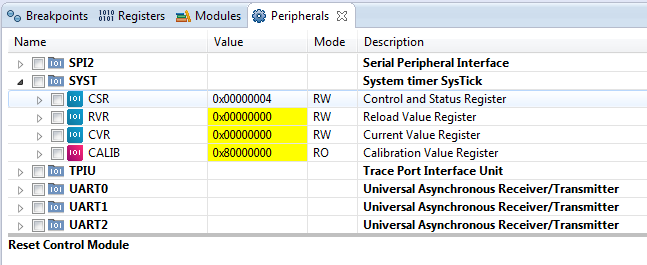
- After launching the target registers may be examined in the Peripheral view.
Comments about troubleshooting given in Erich's posting should be equally useful with USBDM launches.
- Mark as Read
- Mark as New
- Bookmark
- Permalink
- Report Inappropriate Content
Why is it always necessary to terminate the last debugging session before starting a new one. This is not the way it was in Code Warrior. Is there anyway to workaround this or fix this?
- Mark as Read
- Mark as New
- Bookmark
- Permalink
- Report Inappropriate Content
Hi David,
It is a problem how Eclipse GDB launches the debug session, or how the started session checks if it is already running. This needs to be done at the plugin level. CodeWarrior has it implemented as it is using its own debug engine.
Normal GDB launcher plugins do not check this.
I'm only aware that the GNU ARM Eclipse one (which is in KDS v3.0.0) can check if there is already a debug session running, and offers this dialog:
But it is for Segger J-Link only (P&E and OpenOCD have not implemented that (yet?)).
So the workaround is to use J-Link in that case. For P&E or OpenOCD you have to terminate the debug session first.
Erich

