- Forums
- Product Forums
- General Purpose MicrocontrollersGeneral Purpose Microcontrollers
- i.MX Forumsi.MX Forums
- QorIQ Processing PlatformsQorIQ Processing Platforms
- Identification and SecurityIdentification and Security
- Power ManagementPower Management
- MCX Microcontrollers
- S32G
- S32K
- S32V
- MPC5xxx
- Other NXP Products
- Wireless Connectivity
- S12 / MagniV Microcontrollers
- Powertrain and Electrification Analog Drivers
- Sensors
- Vybrid Processors
- Digital Signal Controllers
- 8-bit Microcontrollers
- ColdFire/68K Microcontrollers and Processors
- PowerQUICC Processors
- OSBDM and TBDML
- S32M
-
- Solution Forums
- Software Forums
- MCUXpresso Software and ToolsMCUXpresso Software and Tools
- CodeWarriorCodeWarrior
- MQX Software SolutionsMQX Software Solutions
- Model-Based Design Toolbox (MBDT)Model-Based Design Toolbox (MBDT)
- FreeMASTER
- eIQ Machine Learning Software
- Embedded Software and Tools Clinic
- S32 SDK
- S32 Design Studio
- GUI Guider
- Zephyr Project
- Voice Technology
- Application Software Packs
- Secure Provisioning SDK (SPSDK)
- Processor Expert Software
- MCUXpresso Training Hub
-
- Topics
- Mobile Robotics - Drones and RoversMobile Robotics - Drones and Rovers
- NXP Training ContentNXP Training Content
- University ProgramsUniversity Programs
- Rapid IoT
- NXP Designs
- SafeAssure-Community
- OSS Security & Maintenance
- Using Our Community
-
- Cloud Lab Forums
-
- Knowledge Bases
- ARM Microcontrollers
- i.MX Processors
- Identification and Security
- Model-Based Design Toolbox (MBDT)
- QorIQ Processing Platforms
- S32 Automotive Processing Platform
- Wireless Connectivity
- CodeWarrior
- MCUXpresso Suite of Software and Tools
- MQX Software Solutions
-
- Home
- :
- Product Forums
- :
- Wireless Connectivity
- :
- Experimental analysis RIGADO R41Z Eval Board in industrial environment
Experimental analysis RIGADO R41Z Eval Board in industrial environment
- Subscribe to RSS Feed
- Mark Topic as New
- Mark Topic as Read
- Float this Topic for Current User
- Bookmark
- Subscribe
- Mute
- Printer Friendly Page
- Mark as New
- Bookmark
- Subscribe
- Mute
- Subscribe to RSS Feed
- Permalink
- Report Inappropriate Content
Hello everybody,
I am inmerged in a project that involves the experimental analysis of Thread protocol thorugh the Rigado R41Z Eval Board in industrial environments where we have face inmmunity and interference issues.
I know how to handle the board at user level with CoAP, manage UART consol, program periphericals, etc. At this point I am able to send though CoAP protocol a message froma node to another. But in order to obtain the needed experimental results of the communication performed, I need to know some data from the board and network:
- The full frame of the message sent between nodes.
- The number of hops performed when I send a message from a node to another.
- Path routing of the message sent between nodes.
- What topology or routing path have the Thread architecture at the moment.
- The MLE advertisement containing the path costs between routers.
- The RSSI between nodes.
To sum up all the relevant information used to characterizate the communication in Thread.
The idea is to place some kind of instrument emitting interference near a node and see in real time the new routing path choosed in the Thread network to solve the interference problem, how many hops performs the node now, the new path costs, etc.
Can I obtain this information from the user application? Is the info located somewhere of the R41Z's Thread Stack? Do I need to use Wireshark to analyze the network? What I need to do to obtain the info?
Thanks in advance,
Diego Comin
Solved! Go to Solution.
- Mark as New
- Bookmark
- Subscribe
- Mute
- Subscribe to RSS Feed
- Permalink
- Report Inappropriate Content
Hi Diego,
Here's some feedback.
- At PHY level in code, you can debug the actual frame to be sent OTA (Over The Air) in the "PhyPdDataRequest()" from the PhyPlmeData.c file. But it will probably be hard to analyze as it will be encrypted by the network layer from Thread.
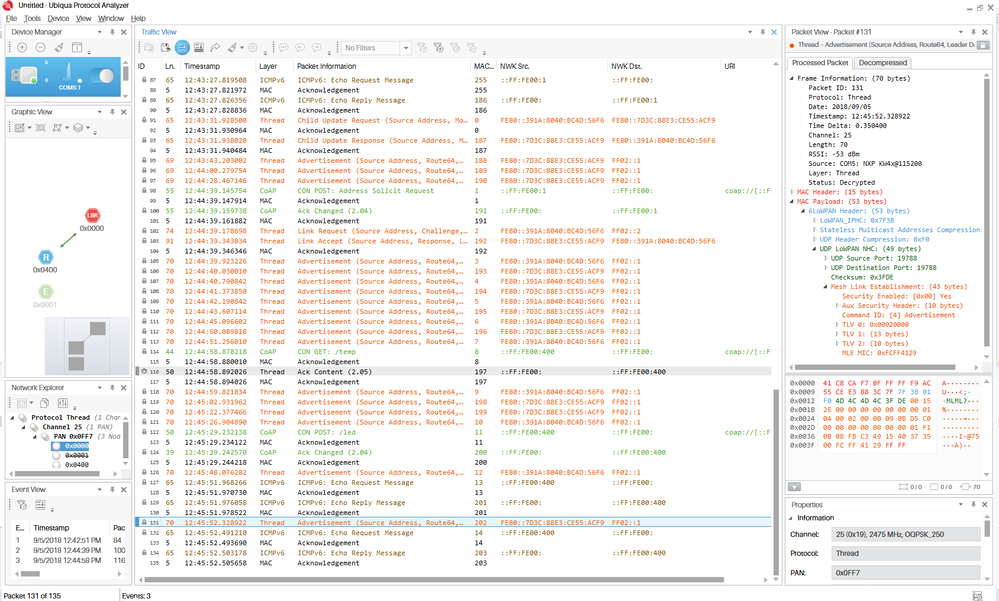
I'd recommend you to look at a sniffer capture using Ubiqua Protocol Analyzer or Wireshark. You will also require an sniffer like the USB-KW41Z. You should be able to see something like this:
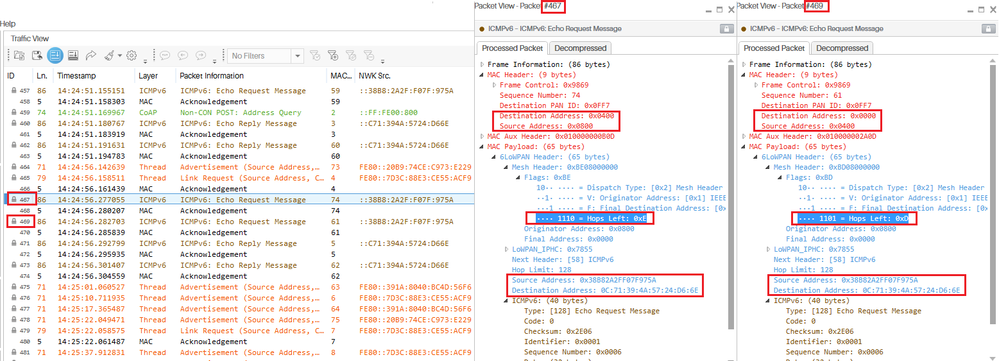
- You can verify the number of hops left from a packet in the 6LoWPAN header. See below an ICMPv6 echo request from a node that will require 2 hops to reach its destination:
- The path a packet takes to reach its destination is dynamic and will depend on Thread topology and link costs, you can also use the sniffer to trace the route taken by a packet to reach its destination. Just follow the IP address and MAC address to identify the hops that the packet will be taking. See image for reference.
- Thread uses a MESH topology.
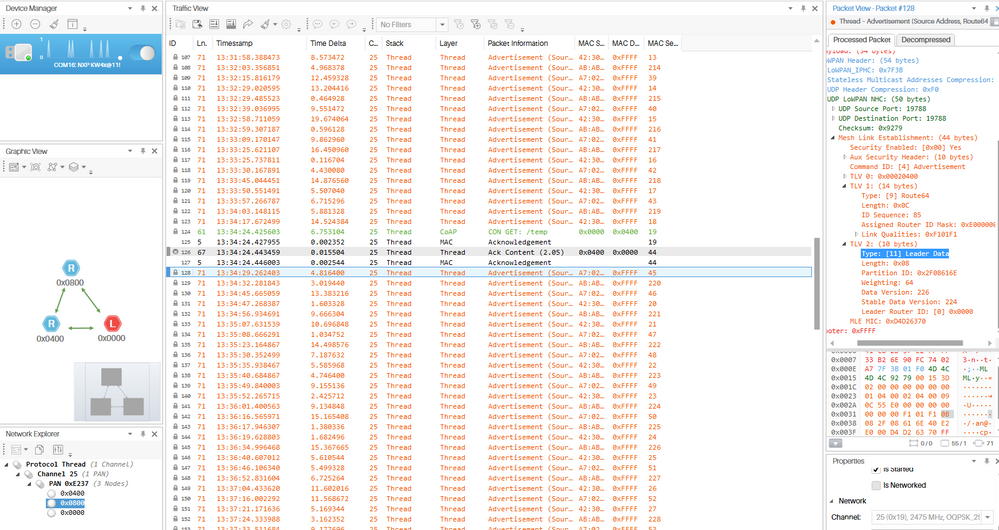
- See the sniffer logs to analyze MLE advertisements or use the shell and type "thr get neighbors" and "thr get routes" to see the L2 links of the current device.
- The RSSI of a given packet can be seen in the sniffer capture from Ubiqua, see the Frame Information section (see first image). In code, you can obtain the RSSI of the last received packet with the PhyGetLastRxRssiValue() function.
Please refer to Thread 1.1 Specifications for details about Thread stack's expected behavior.
Hope this helps.
Regards,
JC
- Mark as New
- Bookmark
- Subscribe
- Mute
- Subscribe to RSS Feed
- Permalink
- Report Inappropriate Content
Thanks a lot JC! I am now using the USB-KW41Z as sniffer and I am able to trace all the Thread variables I need.
In my case I used a Host_controlled_device connected to my Raspberry Pi with a TAP interface to perform as a Border Router but Ubiqua does not recognize it as the Border Router (it actually recognize it as a normal Router), it is normal?
Regards,
Diego Comin
- Mark as New
- Bookmark
- Subscribe
- Mute
- Subscribe to RSS Feed
- Permalink
- Report Inappropriate Content
Yes, it's expected


