- Forums
- Product Forums
- General Purpose MicrocontrollersGeneral Purpose Microcontrollers
- i.MX Forumsi.MX Forums
- QorIQ Processing PlatformsQorIQ Processing Platforms
- Identification and SecurityIdentification and Security
- Power ManagementPower Management
- Wireless ConnectivityWireless Connectivity
- RFID / NFCRFID / NFC
- Advanced AnalogAdvanced Analog
- MCX Microcontrollers
- S32G
- S32K
- S32V
- MPC5xxx
- Other NXP Products
- S12 / MagniV Microcontrollers
- Powertrain and Electrification Analog Drivers
- Sensors
- Vybrid Processors
- Digital Signal Controllers
- 8-bit Microcontrollers
- ColdFire/68K Microcontrollers and Processors
- PowerQUICC Processors
- OSBDM and TBDML
- S32M
- S32Z/E
-
- Solution Forums
- Software Forums
- MCUXpresso Software and ToolsMCUXpresso Software and Tools
- CodeWarriorCodeWarrior
- MQX Software SolutionsMQX Software Solutions
- Model-Based Design Toolbox (MBDT)Model-Based Design Toolbox (MBDT)
- FreeMASTER
- eIQ Machine Learning Software
- Embedded Software and Tools Clinic
- S32 SDK
- S32 Design Studio
- GUI Guider
- Zephyr Project
- Voice Technology
- Application Software Packs
- Secure Provisioning SDK (SPSDK)
- Processor Expert Software
- Generative AI & LLMs
-
- Topics
- Mobile Robotics - Drones and RoversMobile Robotics - Drones and Rovers
- NXP Training ContentNXP Training Content
- University ProgramsUniversity Programs
- Rapid IoT
- NXP Designs
- SafeAssure-Community
- OSS Security & Maintenance
- Using Our Community
-
- Cloud Lab Forums
-
- Knowledge Bases
- ARM Microcontrollers
- i.MX Processors
- Identification and Security
- Model-Based Design Toolbox (MBDT)
- QorIQ Processing Platforms
- S32 Automotive Processing Platform
- Wireless Connectivity
- CodeWarrior
- MCUXpresso Suite of Software and Tools
- MQX Software Solutions
- RFID / NFC
- Advanced Analog
-
- NXP Tech Blogs
- Home
- :
- Software Forums
- :
- S32 Design Studio Knowledge Base
- :
- HOWTO: Secure Debugging from S32DS IDE with S32 Debugger and S32 Debug Probe on S32G274A
HOWTO: Secure Debugging from S32DS IDE with S32 Debugger and S32 Debug Probe on S32G274A
- Subscribe to RSS Feed
- Mark as New
- Mark as Read
- Bookmark
- Subscribe
- Printer Friendly Page
- Report Inappropriate Content
HOWTO: Secure Debugging from S32DS IDE with S32 Debugger and S32 Debug Probe on S32G274A
HOWTO: Secure Debugging from S32DS IDE with S32 Debugger and S32 Debug Probe on S32G274A
NXP devices can be secured either with password or challenge and response authentication scheme. The S32 Debugger included within the S32 Design Studio for S32 Platform IDE with the S32 Debug Probe provides the ability to debug a secured device. This document provides only the necessary commands specific to launching a debug session on secured NXP devices..
Once the device is unsecured, it will remain so until a power-on-reset or destructive reset occurs.
Preparation
- Setup the software tools
- Install S32 Design Studio for S32 Platform
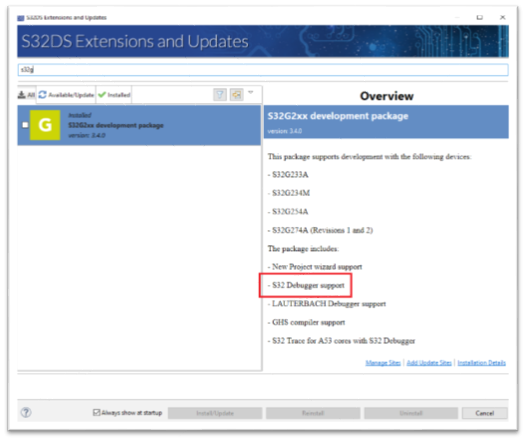
- Install the Development Package for the device you are debugging. In this case, the S32G2xx development package. This package is important as it contains the S32 Debugger support component
- Setup the hardware
- Confirm the setup of the S32G274A evaluation board.
- Connect the power supply cable
- Setup the S32 Debug Probe. Refer to the S32 Debug Probe User Manual for installation instructions.
- Connect the S32 Debug Probe to the evaluation board via JTAG cable.
- Connect the S32 Debug Probe to the host PC via USB cable OR via Ethernet cable (via LAN or directly connected and configured for static IP address) and power supply connected to USB port.
- Confirm the setup of the S32G274A evaluation board.
- Launch S32 Design Studio for S32 Platform
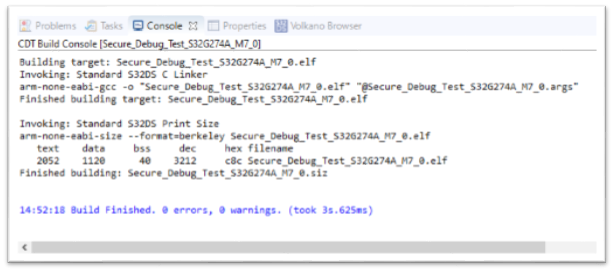
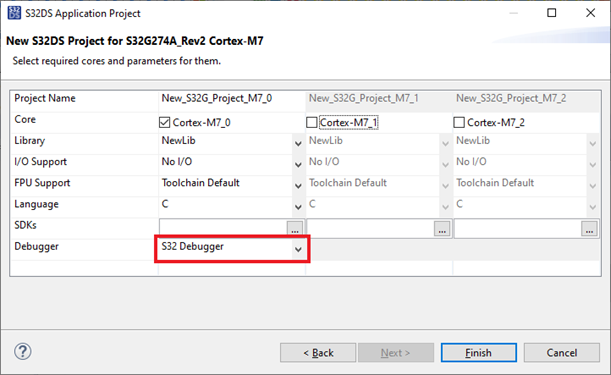
- Open existing project or create a new project and check that it successfully builds. If creating a new project, be sure the S32 Debugger is selected in the New Project Wizard.
Procedure
Before starting a secure debug session, first confirm that the device is indeed secure. Once one core is unlocked, all cores are unlocked and will remain so until a power-on-reset or destructive reset occurs. After confirming the device is secured, then select the procedure which applies to the lifecycle of the SoC to be debugged.
Check the state of the SoC
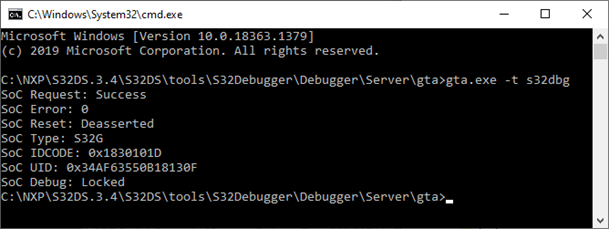
- Open a command window from the installation directory containing the GTA server:
{S32DS Install Path}\S32DS\tools\S32Debugger\Debugger\Server\gta\ - Execute the following command:
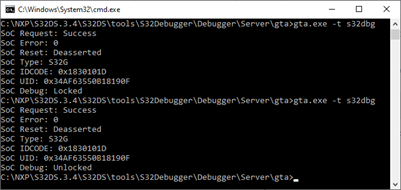
gta.exe -t s32dbg
This will invoke a utility that launces a new GTA server instance and then communicates with the target via the S32 Debug Probe and will request a set of properties of the SoC. These properties are available to be read regardless of security state. The GTA server will close once the information is returned.
As is shown above, the Debug state is ‘Locked’. This means it is secured and the secure debug steps outlined within this document must be used. - There is no way to determine the security enabled on the SoC, so this should be known by the user in order to select the correct authentication scheme. Proceed from here using the method (Password or Challenge & Response) which applies for your SoC security configuration.
Password
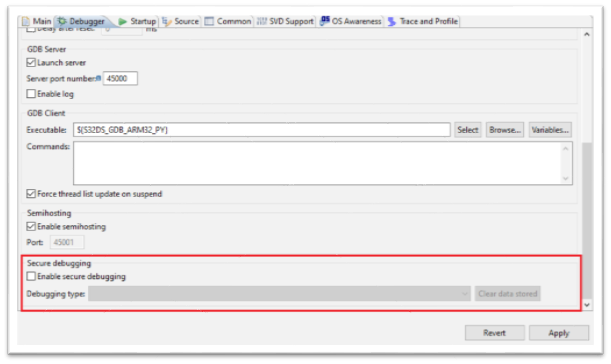
- From S32DS, open the Debug Configurations menu, select the configuration for the project you wish to debug, select the ‘Debugger’ tab and scroll down until the ‘Secure debugging’ section is visible.
- Check the box for ‘Enable secure debugging’ and then select the Debugging type ‘Password’.
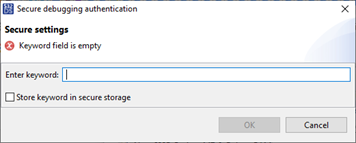
- Click Debug. When the debug session initialization reaches the stage where the password must be entered to unsecure the SoC, the following menu will appear.
- Enter the password. This is a 16-byte value entered as a hexadecimal without the leading ‘0x’. If you choose to check the box for ‘Store keyword in secure storage’, the value entered will be stored within the Eclipse secure storage and will remain available for the duration of the current S32DS instance. This saves the user from having to enter the password again, should the security state of the SoC becomes once again secured.
- Now the debug session initialization will complete and debug activities may be executed as with any SoC which is not secured. After terminating the debug session, the GTA utility can be used again to see the new state of the SoC.
This utility cannot be executed while the debug session is running. It launches a new instance of the GTA server, which would be blocked by the already running debug session.
Challenge & Response
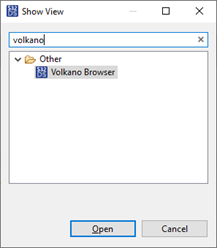
- For the Challenge & Response security scheme, the included Volkano Browser must be used. From the S32DS menu bar, select Window -> Show View -> Other -> ‘Volkano Browser’.
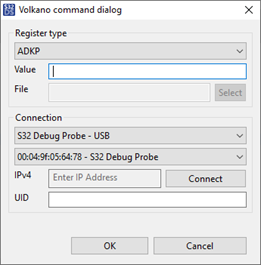
The Volkano Browser will now appear in the current perspective. - Since there is no current key stored in the Volkano local storage, a new key must be registered. Click on ‘Register Key’ to register a new key. This will bring up the Volkano command dialog.
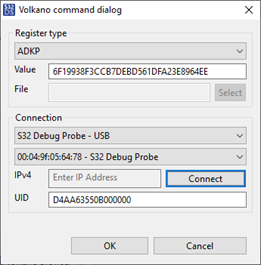
Now enter the ADKP value (Application Debug Key/Password) which is correct for the SoC to be debugged. - The Volkano utility uses the same functionality as the command-line GTA utility shown earlier to check the state of the SoC. This will read the UID from the Soc. Click Connect to the SoC and load the UID (Device Unique ID). The UID is associated with the ADKP when it is registered within the Volkano local storage for easier access in the future.
Click OK to complete the registration of the new key. - Now the key is registered, the debug session can be setup and started.
- Open the Debug Configurations menu, select the configuration for the project you wish to debug, select the ‘Debugger’ tab and scroll down until the ‘Secure debugging’ section is visible.
- Check the box for ‘Enable secure debugging’ and then select the Debugging type ‘Challenge & Response’.
- Click Debug. Now the debug session initialization will complete and debug activities may be executed as with any SoC which is not secured. During debug session initialization, the key that was registered will be used to unsecure the SoC. After terminating the debug session, the GTA utility used earlier can be used again to see the new state of the SoC.
This utility cannot be executed while the debug session is running. It launches a new instance of the GTA server, which would be blocked by the already running debug session.
Troubleshooting
There are some messages displayed when things go wrong that can help to identify the cause of the issue. Due to the sensitive nature of the Secure Debug, the error indications detailed below are inherently general and are provided as a guide for interpreting them to determine the likely cause.
Debug session started when SoC is still secured
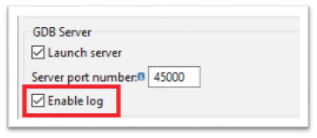
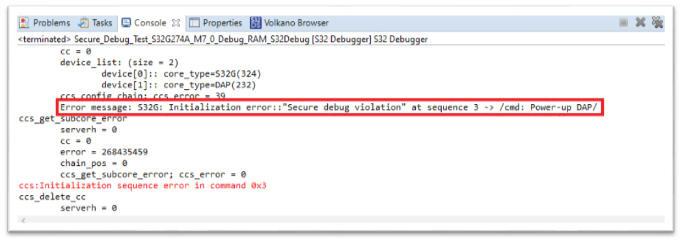
There is an error message reported in the S32 Debugger Console to indicate the SoC is still secure. To see this message the GDB Server log must be enabled in Debug Configurations -> Debugger tab, GDB Server section:
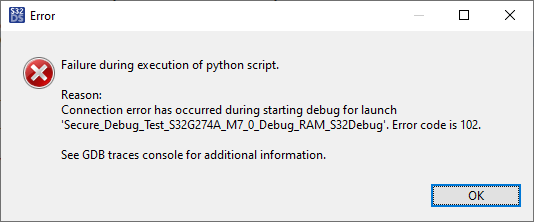
When this error is incurred, first indication is popup error message for Error code 102:
Next, the following text will be displayed in the S32 Debugger console window:
If needed, select this view from the menu:
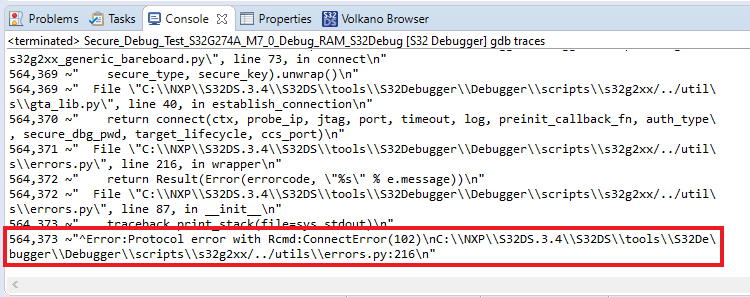
In addition, if GDB Traces log is enabled, the following error message can be found in the gdb traces console view:
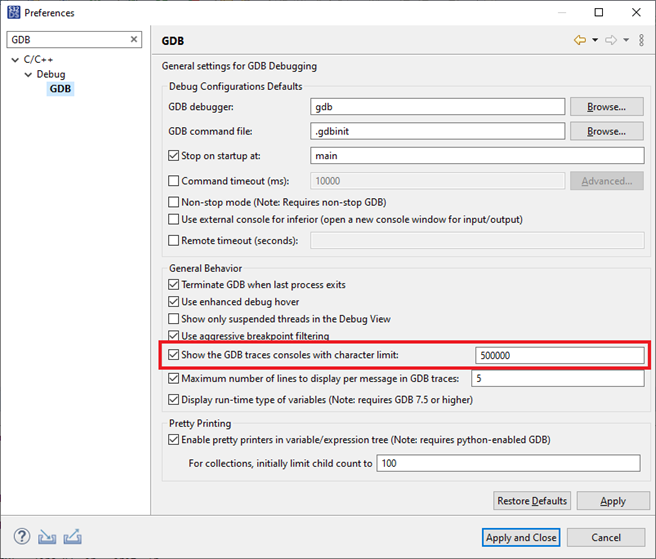
Enable the GDB Traces log in Window->Preferences, then search on GDB:
To select the view from console:
Incorrect Challenge/Response Or Password
If the SoC is setup for Challenge & Response security scheme, but Password security scheme is selected in Debug Configuration, or Challenge & Response is correctly selected but the wrong ADKP value is provided, below are the expected error messages. The result is same if the SoC is setup for Password and either Challenge & Response or wrong password is used.
First error message is Error code 601:
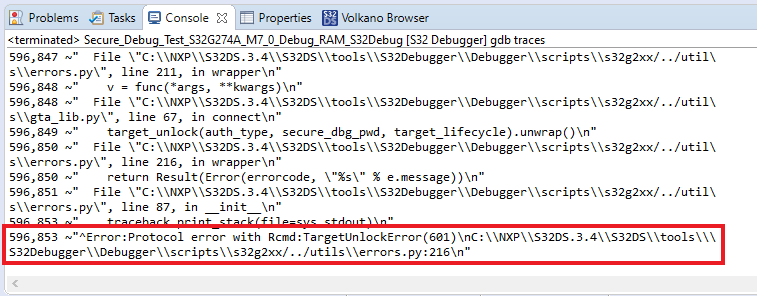
Next, the gdb traces console displays the following error:
There is no error displayed in the S32 Debugger console.
- Mark as Read
- Mark as New
- Bookmark
- Permalink
- Report Inappropriate Content
Hello @Riyasma07, the proper method to request support is to post to the main forum, not a comment on a knowledgebase article.
