- Forums
- Product Forums
- General Purpose MicrocontrollersGeneral Purpose Microcontrollers
- i.MX Forumsi.MX Forums
- QorIQ Processing PlatformsQorIQ Processing Platforms
- Identification and SecurityIdentification and Security
- Power ManagementPower Management
- Wireless ConnectivityWireless Connectivity
- RFID / NFCRFID / NFC
- Advanced AnalogAdvanced Analog
- MCX Microcontrollers
- S32G
- S32K
- S32V
- MPC5xxx
- Other NXP Products
- S12 / MagniV Microcontrollers
- Powertrain and Electrification Analog Drivers
- Sensors
- Vybrid Processors
- Digital Signal Controllers
- 8-bit Microcontrollers
- ColdFire/68K Microcontrollers and Processors
- PowerQUICC Processors
- OSBDM and TBDML
- S32M
- S32Z/E
-
- Solution Forums
- Software Forums
- MCUXpresso Software and ToolsMCUXpresso Software and Tools
- CodeWarriorCodeWarrior
- MQX Software SolutionsMQX Software Solutions
- Model-Based Design Toolbox (MBDT)Model-Based Design Toolbox (MBDT)
- FreeMASTER
- eIQ Machine Learning Software
- Embedded Software and Tools Clinic
- S32 SDK
- S32 Design Studio
- GUI Guider
- Zephyr Project
- Voice Technology
- Application Software Packs
- Secure Provisioning SDK (SPSDK)
- Processor Expert Software
- Generative AI & LLMs
-
- Topics
- Mobile Robotics - Drones and RoversMobile Robotics - Drones and Rovers
- NXP Training ContentNXP Training Content
- University ProgramsUniversity Programs
- Rapid IoT
- NXP Designs
- SafeAssure-Community
- OSS Security & Maintenance
- Using Our Community
-
- Cloud Lab Forums
-
- Knowledge Bases
- ARM Microcontrollers
- i.MX Processors
- Identification and Security
- Model-Based Design Toolbox (MBDT)
- QorIQ Processing Platforms
- S32 Automotive Processing Platform
- Wireless Connectivity
- CodeWarrior
- MCUXpresso Suite of Software and Tools
- MQX Software Solutions
- RFID / NFC
- Advanced Analog
-
- NXP Tech Blogs
- Home
- :
- ソフトウェア・フォーラム
- :
- S32 デザインスタジオ・ナレッジベース
- :
- HOWTO: Debugging BBE32 DSP on S32R45 Using S32 Debugger
HOWTO: Debugging BBE32 DSP on S32R45 Using S32 Debugger
- RSS フィードを購読する
- 新着としてマーク
- 既読としてマーク
- ブックマーク
- 購読
- 印刷用ページ
- 不適切なコンテンツを報告
HOWTO: Debugging BBE32 DSP on S32R45 Using S32 Debugger
HOWTO: Debugging BBE32 DSP on S32R45 Using S32 Debugger
The NXP device S32R45 has accelerators that can be programmed. The S32 Debugger included within the S32 Design Studio for S32 Platform IDE with the S32 Debug Probe provides the ability to debug these accelerators. The accelerator covered in this document: BBE32.
Section map:
Preparation
Setup the software tools
Setup the hardware
Procedure
Create A New Debug Configuration
Simulator
Physical Hardware
Start A Debug Session
Standalone
Multi-Core
Debugging BBE32 DSP Once Debug Session is Started
Preparation
- Setup the software tools
- Install S32 Design Studio for S32 Platform
- Install the S32R4xx development package, the Radar extension package for s32R4xx, and the BBE32 DSP Add-On Package for S32R45.
- Setup the hardware
- Confirm the setup of the S32R45 evaluation board.
- Connect the power supply cable
- Setup the S32 Debug Probe. Refer to the S32 Debug Probe User Manual for installation instructions.
- Connect the S32 Debug Probe to the evaluation board via JTAG cable.
- Connect the S32 Debug Probe to the host PC via USB cable OR via Ethernet cable (via LAN or directly connected and configured for static IP address) and power supply connected to USB port.
- Confirm the setup of the S32R45 evaluation board.
- Launch S32 Design Studio for S32 Platform
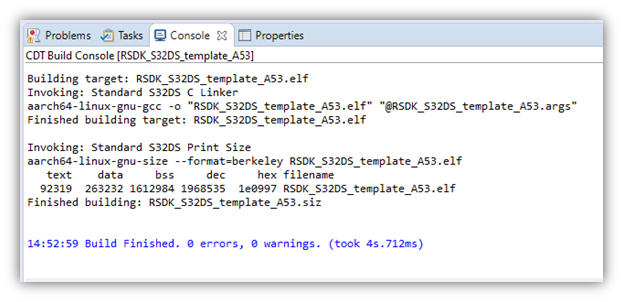
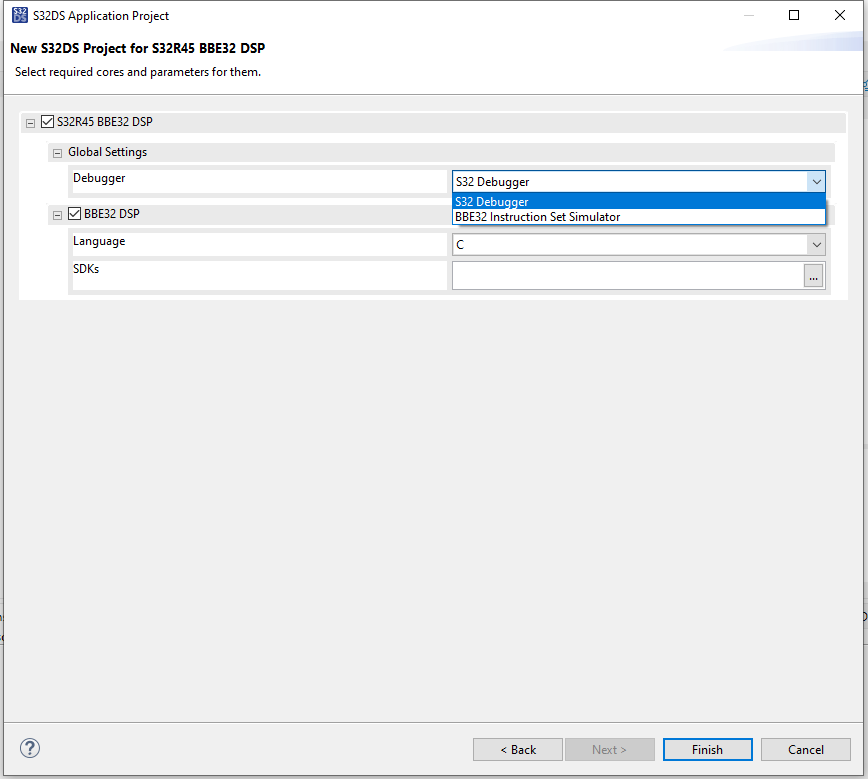
- Open existing project or create a new project and check that it successfully builds. If creating a new project, be sure the S32 Debugger is selected in the New Project Wizard.
Procedure
The procedure for starting a debug session and accessing the associated accelerator-specific registers is detailed here.
The BBE32 DSP debugging requires some additional setup beyond the installation of the BBE32 DSP Add-On Package for S32R45. The BBE32 has a different license from the one for S32 Design Studio. This license must be located using the ‘LM_LICENSE_FILE’ environment variable, as instructed within the provided document "{S32DS Install DIR}\Release_Notes\S32R45_BBE32_DSP_Release_Notes.pdf".
Debugging the BBE32 DSP is performed on physical hardware. This is conducted through one of two methods:
- Standalone: the BBE32 DSP executable is loaded by a debugger over JTAG using a probe and only the BBE32 DSP core is executed and available for debugging.
- Multi-core: the BBE32 DSP executable is included within A53 executable, the A53 application loads the BBE32 DSP executable to the BBE32 DSP core and both A53 and BBE32 DSP core are available for debugging. The debug connection is made to the two cores through one of two methods:
- Baremetal/Bareboard: the debugger connects to both the A53 and BBE32 DSP cores using the probe over JTAG.
- Linux BSP: the debugger connects to the A53 core, which is running Linux BSP, using a remote Linux connection over Ethernet and then connects to the BBE32 DSP core using the debug probe over JTAG.
Before a debug session can be started a debug configuration must exist.
Create A New Debug Configuration
If the New Project Wizard was used to create the project using the S32DS Application Project option, then there was an opportunity to select the desired debugger from within the wizard. If the desired debugger option was selected at this time, then the needed configuration already exists and will only require adjustments to the hardware connection settings.
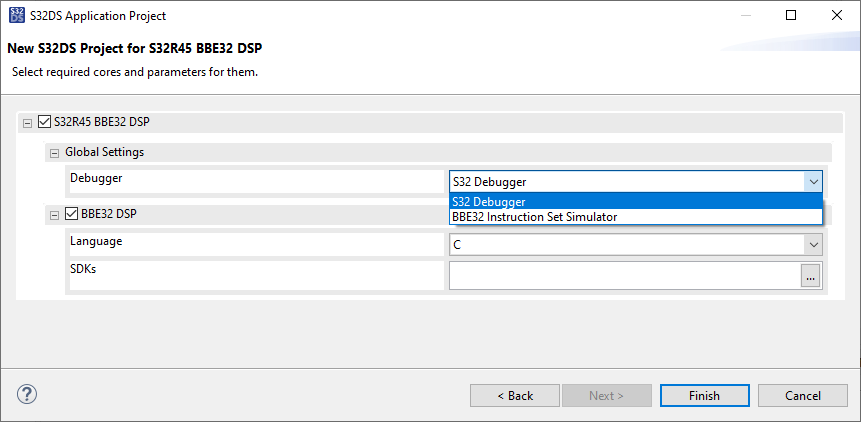
If the New Project Wizard was not used to create the project OR the currently desired debugger was not the one selected at the time of project creation, a new debug configuration must be created.
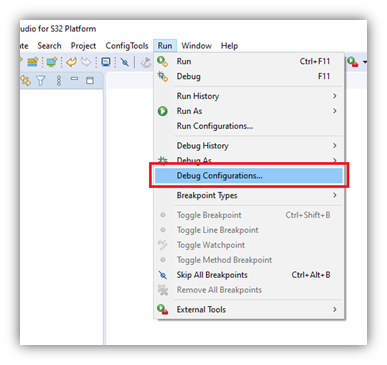
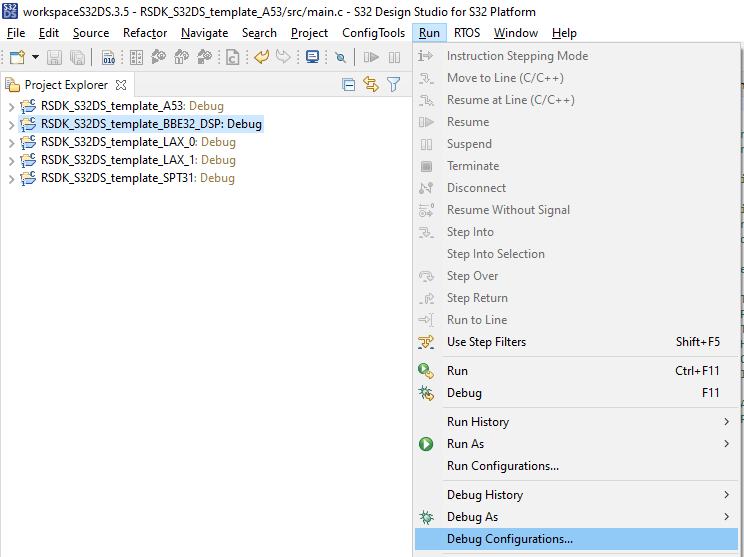
- With the existing project selected in Project Explorer, open the Debug Configurations Menu: Run -> Debug Configurations
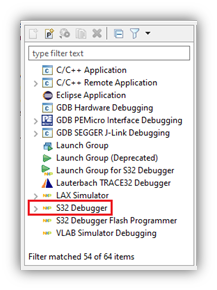
Having the existing project selected in the Project Explorer view will make the creation of a new launch configuration easier as many settings will be imported from the selected project. To select a project, click on it so it becomes highlighted. - Next, select the debugger for which the new debug configuration will be created.
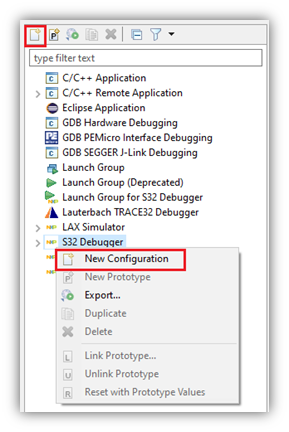
- To create the new configuration, either click on the ‘New launch configuration’ button from the toolbar at the top and to the left, or right-click on the ‘S32 Debugger’ and select ‘New Configuration’ from the menu.
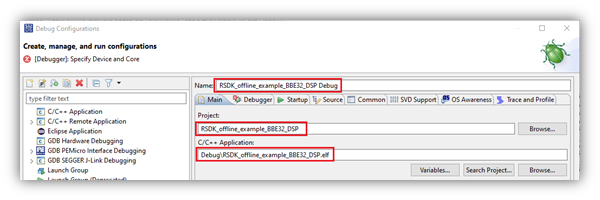
- g configuration will contain the project’s name and the Project and C/C++ Application fields will be populated as well. The C/C++ Application field will only be populated if the build output executable exists. Confirm these values are correct before moving on.
- There is an error showing that the Device core ID is not specified on the Debugger tab. Switch to the Debugger tab and click on the button ‘Select device and core’.
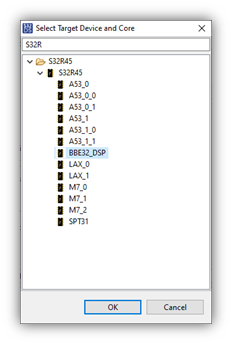
- From the Select Target Device and Core window, expand the listing until all cores are listed. Notice that all supported cores on the S32R45 are listed. Select the desired BBE32 DSP core and click OK.
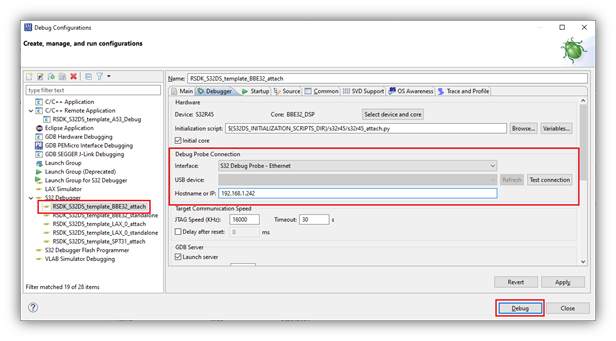
- Now that the device and core are selected, a generic initialization script associated with the BBE32 DSP is selected automatically, however, this may not be the correct one. If debugging Standalone, meaning only BBE32 DSP core will be debugged, then the automatic selection ‘s32r45_generic_bareboard_all_cores.py’ is correct. This script will initialize all of the cores so the BBE32 DSP can execute properly. If debugging Multicore, meaning both A53 and BBE32 DSP will be debugged, then the A53 and BBE32 DSP cores will already be initialized by the time the debugging on BBE32 DSP begins. So a different script that doesn't initialize all of the cores is needed. Click ‘Browse’ and navigate to ‘{install_dir}\S32DS.3.5\S32DS\tools\S32Debugger\Debugger\scripts\s32r45’ and select the script ‘s32r45_attach.py’. The attach script will allow to start debugging on a core that is already initialized. Refer to the document 'README.txt' located in the same folder as these script files for details on all of the provided scripts.
- Confirm the setting of the ‘Initial core’ checkbox. This box should be checked within the debug configuration that establishes the first connection to the target device via S32 Debug Probe. When this box is checked, the Debug Probe Connection interface and GDB Server settings become available. The probe connection only needs to be configured once and only one GDB Server needs to be running for each debug session. Therefore, this box should be checked for standalone BBE32 DSP debugging or for multicore debugging where A53 core is debugged via Remote Linux. If the A53 and BBE32 DSP cores are debugged bareboard (no Linux) via the S32 Debug Probe, then this box should be checked for the A53 debug configuration and should not be checked for the BBE32 DSP debug configuration.
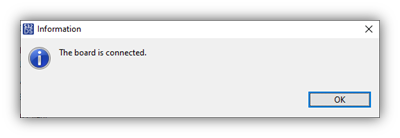
- If the initial core box is checked, then setup the Debug Probe Connection. Select either USB or Ethernet, depending upon your hardware setup. If USB is selected, the COM port for the S32 Debug Probe will automatically be detected (unless not connected or more than one probe is connected). If Ethernet is selected, then enter either the hostname (fsl + last 6 digits of MAC address) or IP address. It is highly recommended to press the ‘Test connection’ button to confirm the hardware connection is correctly configured. See the included ‘S32_Debug_Probe_User_Guide.pdf’ for more details on the setup of the S32 Debug Probe.
- Check that the GDB Client section has the correct path to the BBE32 DSP GDB executable. It should point to the variable ‘S32DS_R45_GDB_XTENSA_PY_PATH’.
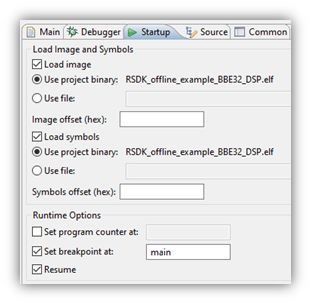
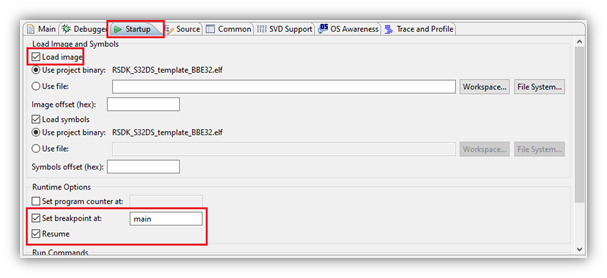
- Startup tab check the following settings
- Load image is checked for standalone debugging, NOT checked for multicore debugging. Basically, if it is loaded by A53 core (contained in A53 ELF file), then it does not need to be loaded.
- Load symbols is checked. The only time you would not check this box is if there is no project binary containing symbols available.
- Set breakpoint at main and Resume are checked for standalone debugging, NOT checked for multicore debugging.
- Now you are ready to start debugging.
Start A Debug Session
For convenience, the example project for S32 Design Studio from the RSDK, ‘RSDK_S32DS_template’, will be used to demonstrate standalone BBE32 DSP and multi-core A53/BBE32 DSP debugging. For instructions on loading this example project to your workspace, see ‘HOWTO: Create New Project from Example RSDK_S32DS_template from Radar SDK’.
Standalone
For the standalone bareboard debugging of only BBE32 DSP core using the RSDK_S32DS_template example, here are the steps which would be required.
- Right-click on the BBE32 project and select Build Project to ensure it builds clean and that the executable exists.
- From the menu at the top, select Run -> Debug Configurations…
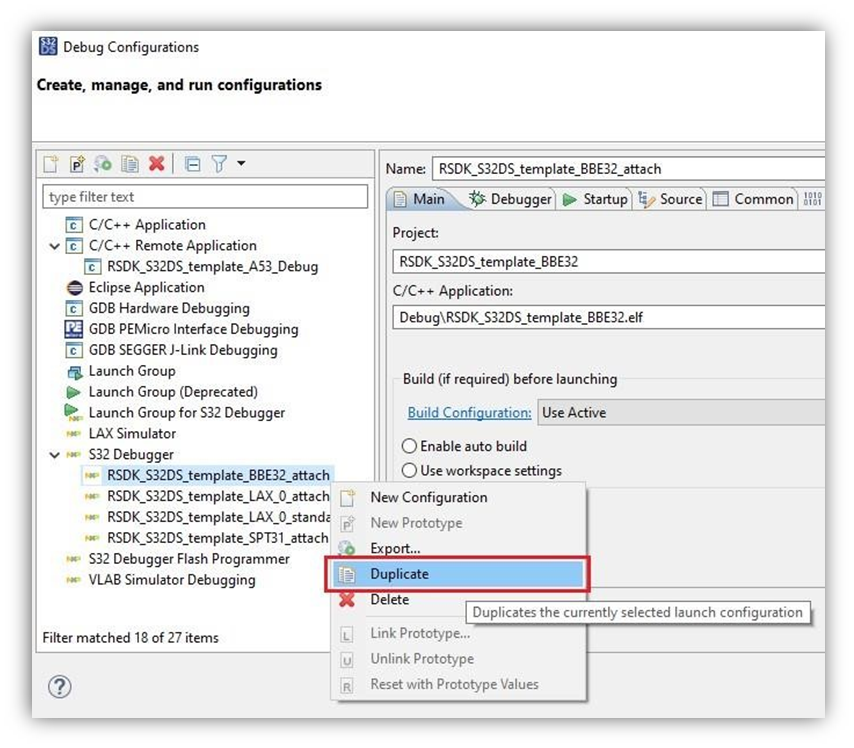
- Select the standalone debug configuration for BBE32 core. In the case of the RSDK_S32DS_template example project, only the multi-core debug configuration is supported. In this case, the standalone configuration will need to be created. Right click on the multi-core configuration and select Duplicate. This will create an identical configuration.
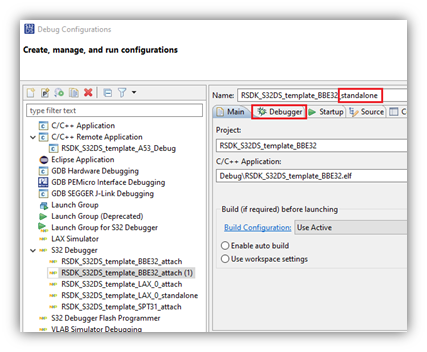
- Change the name as desired and then select the Debugger tab.
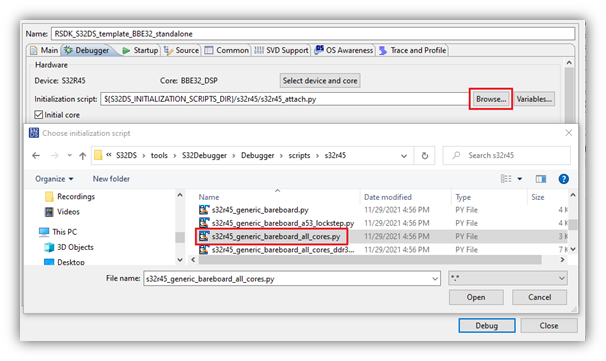
- Click Browse next to Initialization script and navigate to the directory ‘{install_dir}\S32DS.3.5\S32DS\tools\S32Debugger\Debugger\scripts\s32r45’. Select the script ‘s32r45_generic_bareboard_all_cores.py’.
- Adjust the Debug Probe Connection settings to match your HW setup. Use the Test connection button to confirm.
- Select the Startup tab. For standalone debugging the image file will not be loaded by the A53 core, so it must be loaded by the S32 Debugger. Check the boxes for Load image, Set breakpoint at: and Resume.
- Click Debug to start the debug session. All of the settings made will be applied and the debug session will be launched. The BBE32 will execute to the first line in main().
A53 / BBE32 DSP Multi-core
For multi-core debugging, the A53 core is executing an application on the Linux BSP. The EVB should be setup to boot from a flash device which has been loaded with the S32R45 Linux BSP.
- Before beginning the debug sessions, be sure to load the driver dependencies (oal_driver, rsdk_spt_driver, and rsdk_lax_driver) as described in the RSDK User Manual, RSDK Offline Example section ‘Running the application’.
- Start A53 debug. From the menu at the top, select Run -> Debug Configurations…
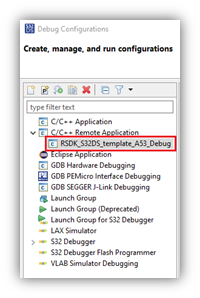
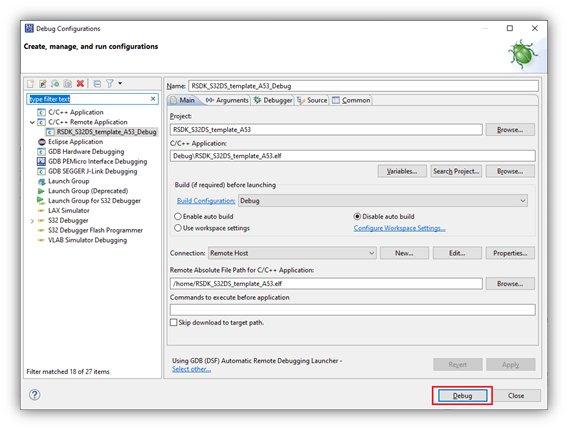
- In the Debug Configurations menu, from the configuration list, expand the ‘C/C++ Remote Application’ group and select the ‘RSDK_S32DS_template_A53_Debug’ configuration.
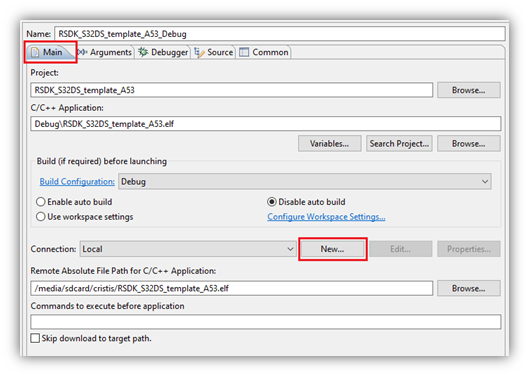
- On the Main tab, create a new connection for using the IP address of the EVB. The IP address could be determined either by issuing a Linux command over the serial connection, such as ‘ifconfig’, by accessing the local network connected device list, or perhaps the EVB was setup with a static IP address and it is already known.
- Click New… in the Connection section.
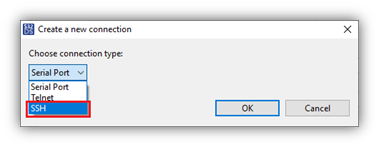
- Select ‘SSH’ for connection type.
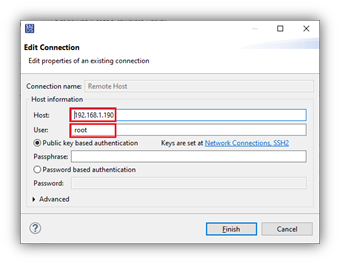
- Enter the IP address in Host: field, use ‘root’ in User: field, and leave password field empty.
- Click New… in the Connection section.
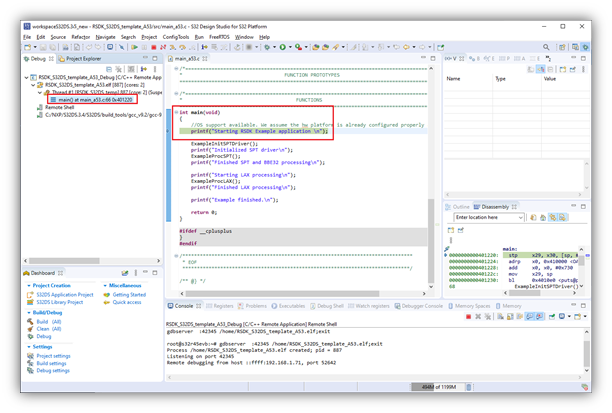
- Click Debug to start debugging on the A53 core.
- The debugger will launch and execute until the first executable line in main(). See Debugger tab in Debug Configurations menu to adjust this setting.
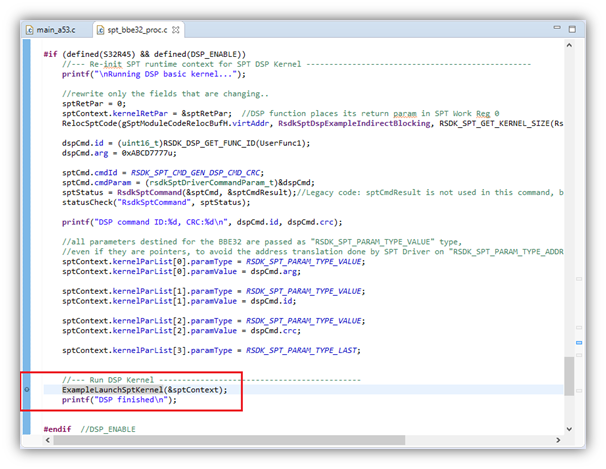
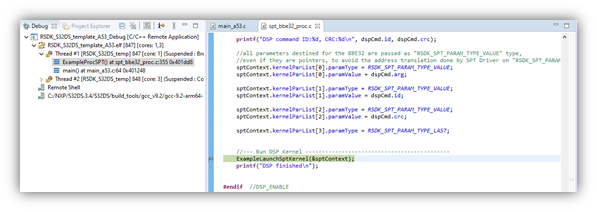
- Once the A53 debug session is running, advance the program counter to a line after the desired DSP kernel is loaded to memory but before the DSP kernel is launched. In the example here, this would be in ‘spt_bbe32_proc.c’, line 355, where ‘ExampleLaunchSptKernel()’ function is called. This is best done by setting a breakpoint on the line and clicking Resume.
- After the breakpoint is reached, the BBE32 DSP debug session can be started.
- Return to the Debug Configurations menu, select the BBE32 DSP debug configuration ‘RSDK_S32DS_template_BBE32_attach’, confirm the Debug Probe Connection settings and click Debug.
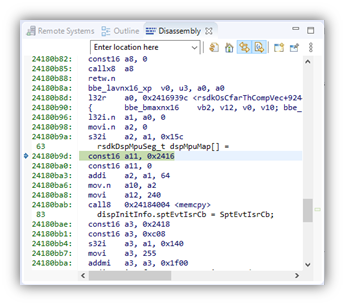
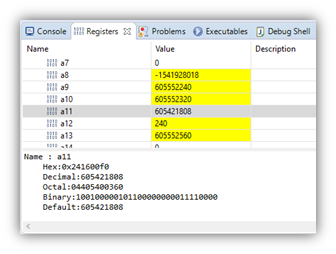
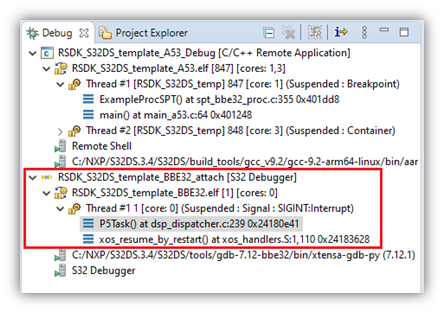
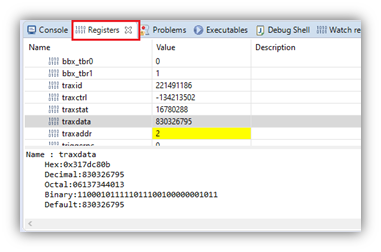
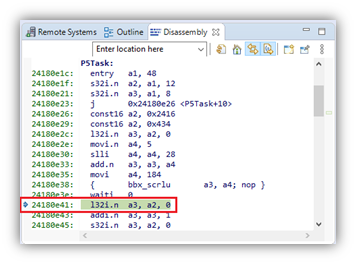
- Wait for the BBE32 debug session to launch and stop in the code. Select the BBE32 debug thread to change the context of the Source, Disassembly, Registers and etc.views. Now you can step through the assembly code, access registers, etc.
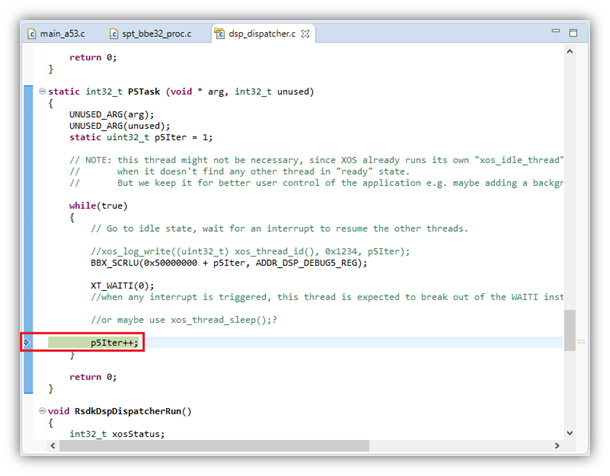
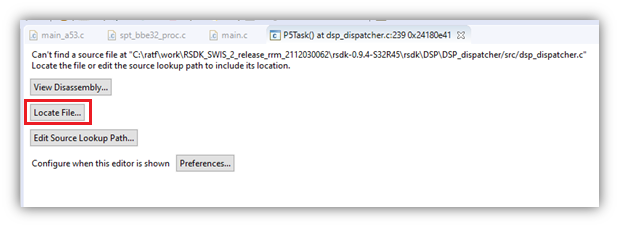
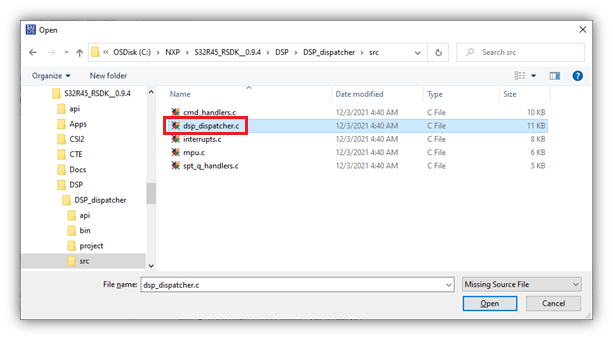
To see this source code, it may be necessary to locate the file from the RSDK installation folder.

