
- Forums
- Product Forums
- General Purpose MicrocontrollersGeneral Purpose Microcontrollers
- i.MX Forumsi.MX Forums
- QorIQ Processing PlatformsQorIQ Processing Platforms
- Identification and SecurityIdentification and Security
- Power ManagementPower Management
- Wireless ConnectivityWireless Connectivity
- RFID / NFCRFID / NFC
- Advanced AnalogAdvanced Analog
- Neural Processing UnitsNeural Processing Units
- MCX Microcontrollers
- S32G
- S32K
- S32V
- MPC5xxx
- Other NXP Products
- S12 / MagniV Microcontrollers
- Powertrain and Electrification Analog Drivers
- Sensors
- Vybrid Processors
- Digital Signal Controllers
- 8-bit Microcontrollers
- ColdFire/68K Microcontrollers and Processors
- PowerQUICC Processors
- OSBDM and TBDML
- S32M
- S32Z/E
-
- Solution Forums
- Software Forums
- MCUXpresso Software and ToolsMCUXpresso Software and Tools
- CodeWarriorCodeWarrior
- MQX Software SolutionsMQX Software Solutions
- Model-Based Design Toolbox (MBDT)Model-Based Design Toolbox (MBDT)
- FreeMASTER
- eIQ Machine Learning Software
- Embedded Software and Tools Clinic
- S32 SDK
- S32 Design Studio
- GUI Guider
- Zephyr Project
- Voice Technology
- Application Software Packs
- Secure Provisioning SDK (SPSDK)
- Processor Expert Software
- Generative AI & LLMs
-
- Topics
- Mobile Robotics - Drones and RoversMobile Robotics - Drones and Rovers
- NXP Training ContentNXP Training Content
- University ProgramsUniversity Programs
- Rapid IoT
- NXP Designs
- SafeAssure-Community
- OSS Security & Maintenance
- Using Our Community
-
- Cloud Lab Forums
-
- Knowledge Bases
- ARM Microcontrollers
- i.MX Processors
- Identification and Security
- Model-Based Design Toolbox (MBDT)
- QorIQ Processing Platforms
- S32 Automotive Processing Platform
- Wireless Connectivity
- CodeWarrior
- MCUXpresso Suite of Software and Tools
- MQX Software Solutions
- RFID / NFC
- Advanced Analog
- Neural Processing Units
-
- NXP Tech Blogs
- Home
- :
- MCUXpresso Software and Tools
- :
- MCUXpresso IDE
- :
- SWO Int Trace confusion
SWO Int Trace confusion
- Subscribe to RSS Feed
- Mark Topic as New
- Mark Topic as Read
- Float this Topic for Current User
- Bookmark
- Subscribe
- Mute
- Printer Friendly Page
SWO Int Trace confusion
- Mark as New
- Bookmark
- Subscribe
- Mute
- Subscribe to RSS Feed
- Permalink
- Report Inappropriate Content
Hello,
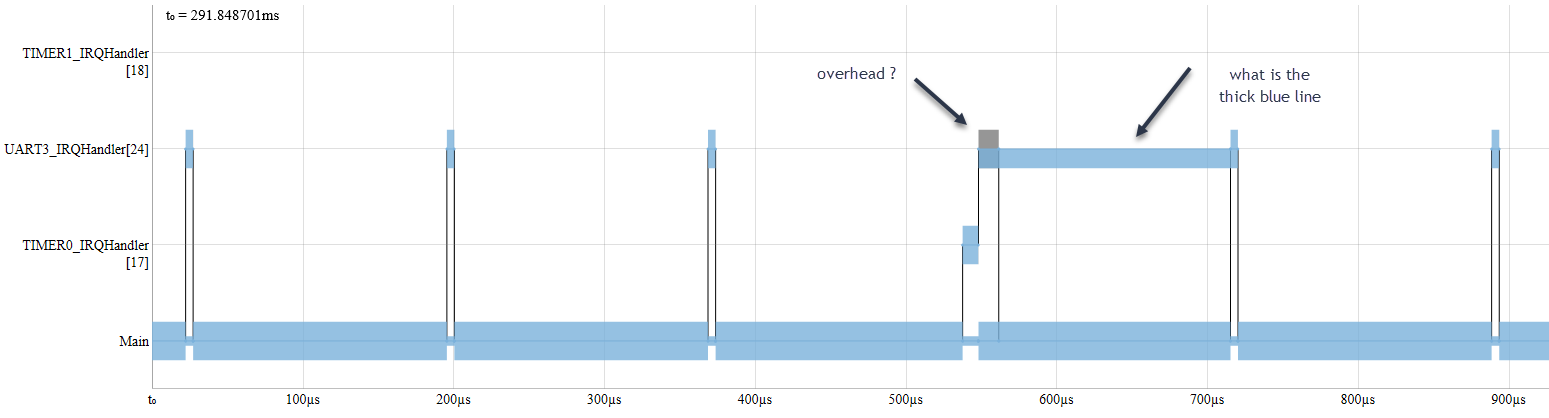
I'm using MCUXpresso IDE 10.2.1 [Build 795] and using the Interrupt Trace View for the first time. I have read the "MCUXpresso IDE Linkserver SWO Trace Guide" and I am still having trouble deciphering a particular sample. In the following screenshot:

What is the gray on top of interrupt [24]? And what is the thick blue line between both interrupts[24]? Nothing in the SWO Int Stats looks out of sorts, but I want to understand what I'm looking at here in the graph.
Thank you and any feedback is greatly appreciated,
Andrei
- Mark as New
- Bookmark
- Subscribe
- Mute
- Subscribe to RSS Feed
- Permalink
- Report Inappropriate Content
Hello Andrei Szeghy,
- The thin blue line in the row represents that interrupt execution is suspended, but not completed.
- About the "gray", could you please zoom in it check ?
BR
Alice
- Mark as New
- Bookmark
- Subscribe
- Mute
- Subscribe to RSS Feed
- Permalink
- Report Inappropriate Content
Hello Alice,
Thanks for the reply and sorry for my delay. That said, I'm not sure I understand... First, as you pointed out, my arrow should have read "what is the thin blue line". Regardless, are you suggesting interrupt [24] was suspended for about 150usec until the interrupt was taken again? Am I mistaken to think execution returned to main() during that time?
Thanks for your patience,
Andrei
- Mark as New
- Bookmark
- Subscribe
- Mute
- Subscribe to RSS Feed
- Permalink
- Report Inappropriate Content
Hello Andrei,
Is this a demo project ? Which one ? I want to test it on my side to check the meaning.
BR
Alice
- Mark as New
- Bookmark
- Subscribe
- Mute
- Subscribe to RSS Feed
- Permalink
- Report Inappropriate Content
Hello Alice,
No, unfortunately it is not a demo project. The interrupts are pretty straightforward though. I changed the priority so that Timer0 is of the highest priority (most critical) and the UART is of a lower priority. This appears to have worked, but I was unsure of why the UART interrupt had the blue line. Perhaps I'll move on and try some further testing to see it's just a bug in the rendering of the graph.
Thanks,
Andrei