- Forums
- Product Forums
- General Purpose MicrocontrollersGeneral Purpose Microcontrollers
- i.MX Forumsi.MX Forums
- QorIQ Processing PlatformsQorIQ Processing Platforms
- Identification and SecurityIdentification and Security
- Power ManagementPower Management
- Wireless ConnectivityWireless Connectivity
- RFID / NFCRFID / NFC
- Advanced AnalogAdvanced Analog
- MCX Microcontrollers
- S32G
- S32K
- S32V
- MPC5xxx
- Other NXP Products
- S12 / MagniV Microcontrollers
- Powertrain and Electrification Analog Drivers
- Sensors
- Vybrid Processors
- Digital Signal Controllers
- 8-bit Microcontrollers
- ColdFire/68K Microcontrollers and Processors
- PowerQUICC Processors
- OSBDM and TBDML
- S32M
- S32Z/E
-
- Solution Forums
- Software Forums
- MCUXpresso Software and ToolsMCUXpresso Software and Tools
- CodeWarriorCodeWarrior
- MQX Software SolutionsMQX Software Solutions
- Model-Based Design Toolbox (MBDT)Model-Based Design Toolbox (MBDT)
- FreeMASTER
- eIQ Machine Learning Software
- Embedded Software and Tools Clinic
- S32 SDK
- S32 Design Studio
- GUI Guider
- Zephyr Project
- Voice Technology
- Application Software Packs
- Secure Provisioning SDK (SPSDK)
- Processor Expert Software
- Generative AI & LLMs
-
- Topics
- Mobile Robotics - Drones and RoversMobile Robotics - Drones and Rovers
- NXP Training ContentNXP Training Content
- University ProgramsUniversity Programs
- Rapid IoT
- NXP Designs
- SafeAssure-Community
- OSS Security & Maintenance
- Using Our Community
-
- Cloud Lab Forums
-
- Knowledge Bases
- ARM Microcontrollers
- i.MX Processors
- Identification and Security
- Model-Based Design Toolbox (MBDT)
- QorIQ Processing Platforms
- S32 Automotive Processing Platform
- Wireless Connectivity
- CodeWarrior
- MCUXpresso Suite of Software and Tools
- MQX Software Solutions
- RFID / NFC
- Advanced Analog
-
- NXP Tech Blogs
- Home
- :
- General Purpose Microcontrollers
- :
- LPC Microcontrollers
- :
- Unable to hit breakpoints on LPC4357 M0 core running FreeRTOS
Unable to hit breakpoints on LPC4357 M0 core running FreeRTOS
- Subscribe to RSS Feed
- Mark Topic as New
- Mark Topic as Read
- Float this Topic for Current User
- Bookmark
- Subscribe
- Mute
- Printer Friendly Page
- Mark as New
- Bookmark
- Subscribe
- Mute
- Subscribe to RSS Feed
- Permalink
- Report Inappropriate Content
Hello everyone,
I am new to multicore devlopment, FreeRTOS and ARM in general. I am using the MCB4300 demo board with the Keil uVision development tools to run the LAN Radio Demo (Keil MCB4357 Evaluation Board and Internet Radio Solution|NXP ).
I am able to build it and run it just fine. I can step through the code on the M4 core (running baremetal code) and set breakpoints, however when I try setting breakpoints on the M0 core (running FreeRTOS) the core never stops even though I know that condition has been reached as I am writing debug statements to a terminal window. Are there any special settings that need to be set when multicore debugging or when using an RTOS?
Thanks!
Solved! Go to Solution.
- Mark as New
- Bookmark
- Subscribe
- Mute
- Subscribe to RSS Feed
- Permalink
- Report Inappropriate Content
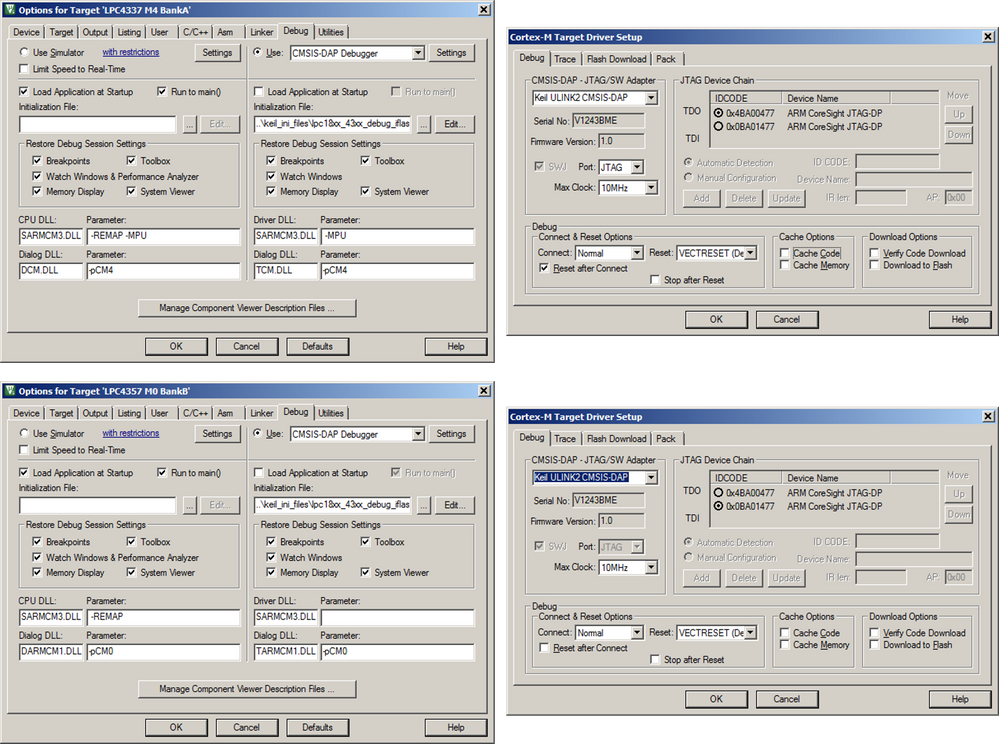
In the CM0 project there was no INI file provided for the debugger start. This means that the debug information from the axf file was not loaded into the debugger, therefore the relation between the source code and the binary code was missing. Anyway, it is indeed possible to set breakpoints, but just in the assembler code window.
Take the attached complete setup or do it simply by yourself, just provide the same ini file for both debug setups:
Regards,
Bernhard.
- Mark as New
- Bookmark
- Subscribe
- Mute
- Subscribe to RSS Feed
- Permalink
- Report Inappropriate Content
Hi nos1989,
Debug breakpoint is no relationship with freertos.
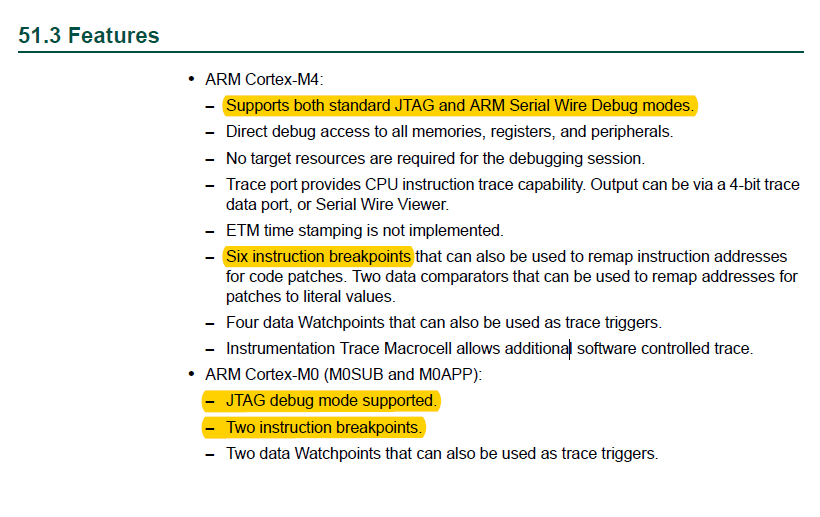
The ARM Cortex-M0 in LPC4357 can support 2 instruction breakpoints, but you need to use JTAG debug mode.
You can find this information in the LPC4357 user manual:
Please check your debug interface, and try again.
If you still have question, please tell me the detail step how reflect your problem, I will test it on my side.
Have a great day,
Kerry
-----------------------------------------------------------------------------------------------------------------------
Note: If this post answers your question, please click the Correct Answer button. Thank you!
-----------------------------------------------------------------------------------------------------------------------
- Mark as New
- Bookmark
- Subscribe
- Mute
- Subscribe to RSS Feed
- Permalink
- Report Inappropriate Content
Kerry,
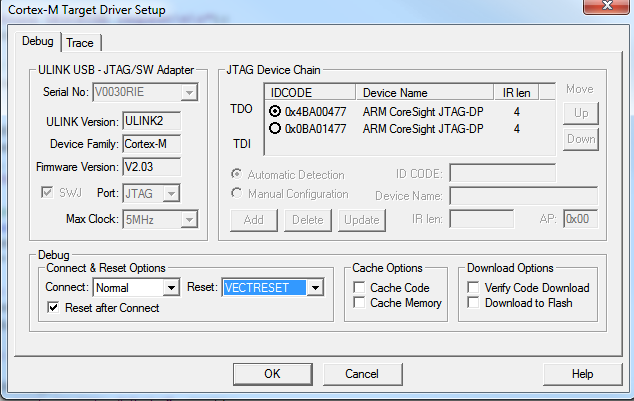
Thank you for your reply. I wasn't working on this project for a little bit, but now just resumed. I am still unable to hit any breakpoints on the M0 core. Again, I know that specific code is executing, because I have some debug messages in that location, outputting to a serial console. The debugger is set to JTAG mode, here's what I have for settings:
Thanks in advanced for the help.
- Mark as New
- Bookmark
- Subscribe
- Mute
- Subscribe to RSS Feed
- Permalink
- Report Inappropriate Content
Almost certainly, your debugger is connected to the M4 and not the M0. If you want to debug the M0, you must connect a debugger to it.
I don’t know how to do this with keil- I use xpresso
- Mark as New
- Bookmark
- Subscribe
- Mute
- Subscribe to RSS Feed
- Permalink
- Report Inappropriate Content
Interesting thought. I have two instances of Keil uVision running, one for each core. It seems that there is some JTAG communication between the cores. For instance, if I start a debugging session on both cores and start running the M0 core, it automatically triggers the M4 core to run.
Can someone with Keil uVision experience chime in on this?
Thanks.
- Mark as New
- Bookmark
- Subscribe
- Mute
- Subscribe to RSS Feed
- Permalink
- Report Inappropriate Content
Hi nos1989, could you find a solution for your problem? I'm stuck with the same. A basic example with both cores running but I can only set breakpoints in M4
Best regards,
Fernando
- Mark as New
- Bookmark
- Subscribe
- Mute
- Subscribe to RSS Feed
- Permalink
- Report Inappropriate Content
In the CM0 project there was no INI file provided for the debugger start. This means that the debug information from the axf file was not loaded into the debugger, therefore the relation between the source code and the binary code was missing. Anyway, it is indeed possible to set breakpoints, but just in the assembler code window.
Take the attached complete setup or do it simply by yourself, just provide the same ini file for both debug setups:
Regards,
Bernhard.
- Mark as New
- Bookmark
- Subscribe
- Mute
- Subscribe to RSS Feed
- Permalink
- Report Inappropriate Content
Thank you very much! That was the problem!! :smileygrin:


