- Forums
- Product Forums
- General Purpose MicrocontrollersGeneral Purpose Microcontrollers
- i.MX Forumsi.MX Forums
- QorIQ Processing PlatformsQorIQ Processing Platforms
- Identification and SecurityIdentification and Security
- Power ManagementPower Management
- Wireless ConnectivityWireless Connectivity
- RFID / NFCRFID / NFC
- Advanced AnalogAdvanced Analog
- MCX Microcontrollers
- S32G
- S32K
- S32V
- MPC5xxx
- Other NXP Products
- S12 / MagniV Microcontrollers
- Powertrain and Electrification Analog Drivers
- Sensors
- Vybrid Processors
- Digital Signal Controllers
- 8-bit Microcontrollers
- ColdFire/68K Microcontrollers and Processors
- PowerQUICC Processors
- OSBDM and TBDML
- S32M
- S32Z/E
-
- Solution Forums
- Software Forums
- MCUXpresso Software and ToolsMCUXpresso Software and Tools
- CodeWarriorCodeWarrior
- MQX Software SolutionsMQX Software Solutions
- Model-Based Design Toolbox (MBDT)Model-Based Design Toolbox (MBDT)
- FreeMASTER
- eIQ Machine Learning Software
- Embedded Software and Tools Clinic
- S32 SDK
- S32 Design Studio
- GUI Guider
- Zephyr Project
- Voice Technology
- Application Software Packs
- Secure Provisioning SDK (SPSDK)
- Processor Expert Software
- Generative AI & LLMs
-
- Topics
- Mobile Robotics - Drones and RoversMobile Robotics - Drones and Rovers
- NXP Training ContentNXP Training Content
- University ProgramsUniversity Programs
- Rapid IoT
- NXP Designs
- SafeAssure-Community
- OSS Security & Maintenance
- Using Our Community
-
- Cloud Lab Forums
-
- Knowledge Bases
- ARM Microcontrollers
- i.MX Processors
- Identification and Security
- Model-Based Design Toolbox (MBDT)
- QorIQ Processing Platforms
- S32 Automotive Processing Platform
- Wireless Connectivity
- CodeWarrior
- MCUXpresso Suite of Software and Tools
- MQX Software Solutions
- RFID / NFC
- Advanced Analog
-
- NXP Tech Blogs
- Home
- :
- General Purpose Microcontrollers
- :
- Kinetis Microcontrollers
- :
- How to view stdout from printf() on TWR_k70 board
How to view stdout from printf() on TWR_k70 board
- Subscribe to RSS Feed
- Mark Topic as New
- Mark Topic as Read
- Float this Topic for Current User
- Bookmark
- Subscribe
- Mute
- Printer Friendly Page
How to view stdout from printf() on TWR_k70 board
- Mark as New
- Bookmark
- Subscribe
- Mute
- Subscribe to RSS Feed
- Permalink
- Report Inappropriate Content
Hello,
I am trying to debug a simple Hello World program. I have tried many ways to view the printf() statement I have placed in the code. I have tried a bare-metal hello example and an MQX hello example and have not been able to see either. I am connecting the board to the computer via usb through the OSJTAG/OSBDM port on the tower board. I have installed the drivers and firmware from PE Micro as well as downloaded the OSBDM Virtual Serial Tower Toolkit. From what I can tell none of the jumpers on the twr_k70 board need to be altered. I am debugging from CodeWarrior 10.4. I have selected the PE Multilink/ OSJTAG/OSBDM - USB Port option for debugging and have successfully built and launched the code. I can blink LEDs but cannot see the output of the printf() statements in the code. Windows 7 recognizes my device as OSBDM/OSJTAG CDC Serial Port (COM17) which makes me believe if I connect to this port I should be able to see my print statements. I have tried Window -> Show View -> Terminal (COM17 38400 8 1 none none) and have also tried the P&E terminal utility connecting to USB_COM but neither gave output.
I looked at this post: How do I get printf output to a console? and it got very convoluted and did not seem to directly address the question. If I missed something here please let me know.
Does anyone know where I can find the output to my print statements on twr_k70 board using OSJTAG/OSBDM?
I also have a P&E Multilink Universal in case that is the way to see the output but I thought that JTAG does support serial.
Thank you for your help!!!
- Mark as New
- Bookmark
- Subscribe
- Mute
- Subscribe to RSS Feed
- Permalink
- Report Inappropriate Content
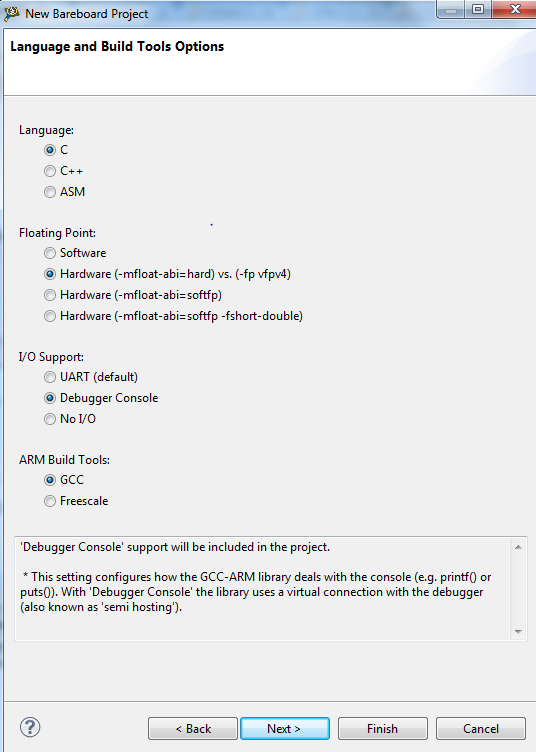
UPDATE: I am able to see printf() on the CW debugging console by creating a bareboard project and selecting Debugger Console under the IO Support option. See image below. This works with either OSJTAG or PE Multilink Universal as the the debugging interface. What I am really trying to do is view UART IO message (printf(), puts()) in a terminal program or the terminal built into code warrior.
My source code looks like this:
#include "derivative.h" /* include peripheral declarations */
#include <stdio.h>
int main(void)
{
int counter = 0;
for(;;) {
counter++;
printf("Hello UART!");
}
return 0;
}
I am not sure what the difference is between selecting UART IO vs Debuggin Console IO. Does anyone know what this changes in the libraries that control the version of printf() is used? Similarly, Does anyone know what the default output of printf() is for an MQX 4.0.1 project is?
Thank you!
- Mark as New
- Bookmark
- Subscribe
- Mute
- Subscribe to RSS Feed
- Permalink
- Report Inappropriate Content
Hello Joe,
In the CodeWarrior User Guide in the page 59 in the table 2-12 "Language and Build Tools Options Page settings - Kinetis derivatives" you can see the differences between these two options.
Regards,
Earl.
- Mark as New
- Bookmark
- Subscribe
- Mute
- Subscribe to RSS Feed
- Permalink
- Report Inappropriate Content
Hello Joe,
Could you please share the projects with this problem?
Best regards,
Earl.

