- Forums
- Product Forums
- General Purpose MicrocontrollersGeneral Purpose Microcontrollers
- i.MX Forumsi.MX Forums
- QorIQ Processing PlatformsQorIQ Processing Platforms
- Identification and SecurityIdentification and Security
- Power ManagementPower Management
- Wireless ConnectivityWireless Connectivity
- RFID / NFCRFID / NFC
- Advanced AnalogAdvanced Analog
- MCX Microcontrollers
- S32G
- S32K
- S32V
- MPC5xxx
- Other NXP Products
- S12 / MagniV Microcontrollers
- Powertrain and Electrification Analog Drivers
- Sensors
- Vybrid Processors
- Digital Signal Controllers
- 8-bit Microcontrollers
- ColdFire/68K Microcontrollers and Processors
- PowerQUICC Processors
- OSBDM and TBDML
- S32M
- S32Z/E
-
- Solution Forums
- Software Forums
- MCUXpresso Software and ToolsMCUXpresso Software and Tools
- CodeWarriorCodeWarrior
- MQX Software SolutionsMQX Software Solutions
- Model-Based Design Toolbox (MBDT)Model-Based Design Toolbox (MBDT)
- FreeMASTER
- eIQ Machine Learning Software
- Embedded Software and Tools Clinic
- S32 SDK
- S32 Design Studio
- GUI Guider
- Zephyr Project
- Voice Technology
- Application Software Packs
- Secure Provisioning SDK (SPSDK)
- Processor Expert Software
- Generative AI & LLMs
-
- Topics
- Mobile Robotics - Drones and RoversMobile Robotics - Drones and Rovers
- NXP Training ContentNXP Training Content
- University ProgramsUniversity Programs
- Rapid IoT
- NXP Designs
- SafeAssure-Community
- OSS Security & Maintenance
- Using Our Community
-
- Cloud Lab Forums
-
- Knowledge Bases
- ARM Microcontrollers
- i.MX Processors
- Identification and Security
- Model-Based Design Toolbox (MBDT)
- QorIQ Processing Platforms
- S32 Automotive Processing Platform
- Wireless Connectivity
- CodeWarrior
- MCUXpresso Suite of Software and Tools
- MQX Software Solutions
- RFID / NFC
- Advanced Analog
-
- NXP Tech Blogs
- Home
- :
- Software Forums
- :
- S32 Design Studio Knowledge Base
- :
- HOWTO: Debug multiple elf files in S32 Design Studio with GDB
HOWTO: Debug multiple elf files in S32 Design Studio with GDB
- Subscribe to RSS Feed
- Mark as New
- Mark as Read
- Bookmark
- Subscribe
- Printer Friendly Page
- Report Inappropriate Content
HOWTO: Debug multiple elf files in S32 Design Studio with GDB
HOWTO: Debug multiple elf files in S32 Design Studio with GDB
There are situations that require debugging multiple executable files within one debug session.
Typical example is debugging the bootloader + application together where each one is a separate executable elf file or S32DS eclipse project.
S32DS project loads the debug information of the generated executable file by default. Anyway GDB supports command to add additional elf files debug information into same debug session. If the executable source files are present on the same machine then the source level debugging of all the elf files is possible.
Let's assume there are two elf files (bootloader and application) and both are built with debug information enabled - build configuration is named "Debug".
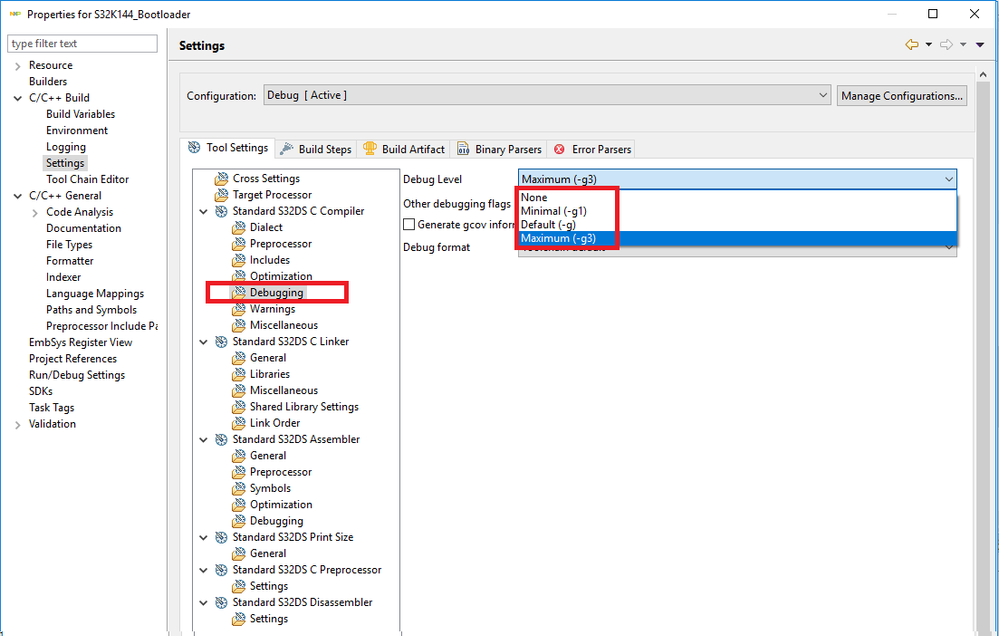
Generation of the debug information for GCC compiler could be set in the Project Properties -> C/C++ Build -> Settings -> Standard S32DS C Compiler -> Debug Level
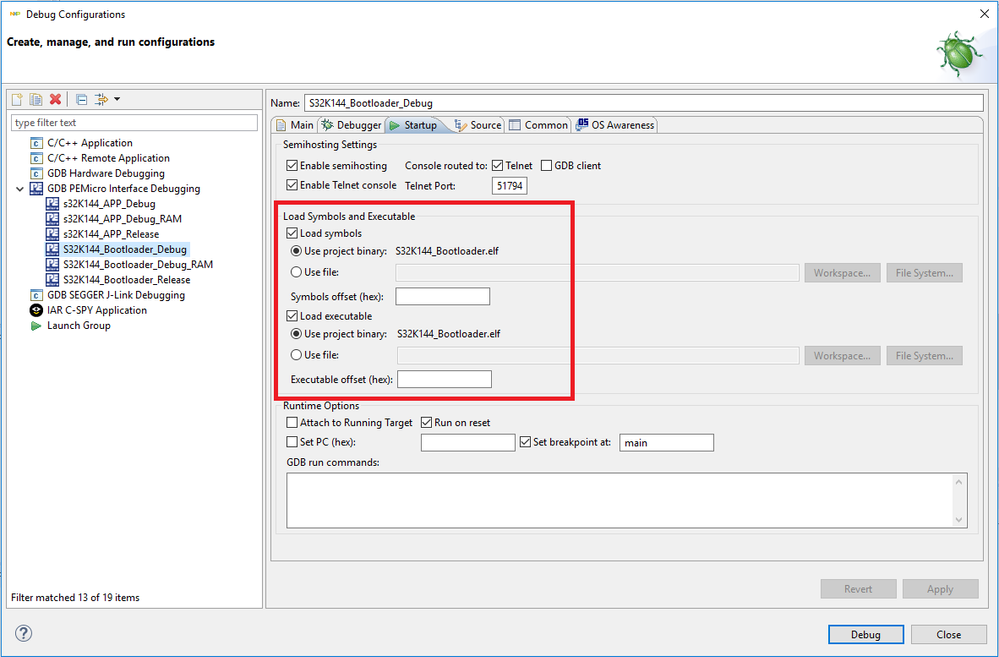
Each debug configuration in S32 Design Studio supports loading or ignoring debug information.
"Load symbols" loads just the debug information whereas "Load executable" basically loads program/code/data sections into MCU memory without debug information. Both options are enabled by default.
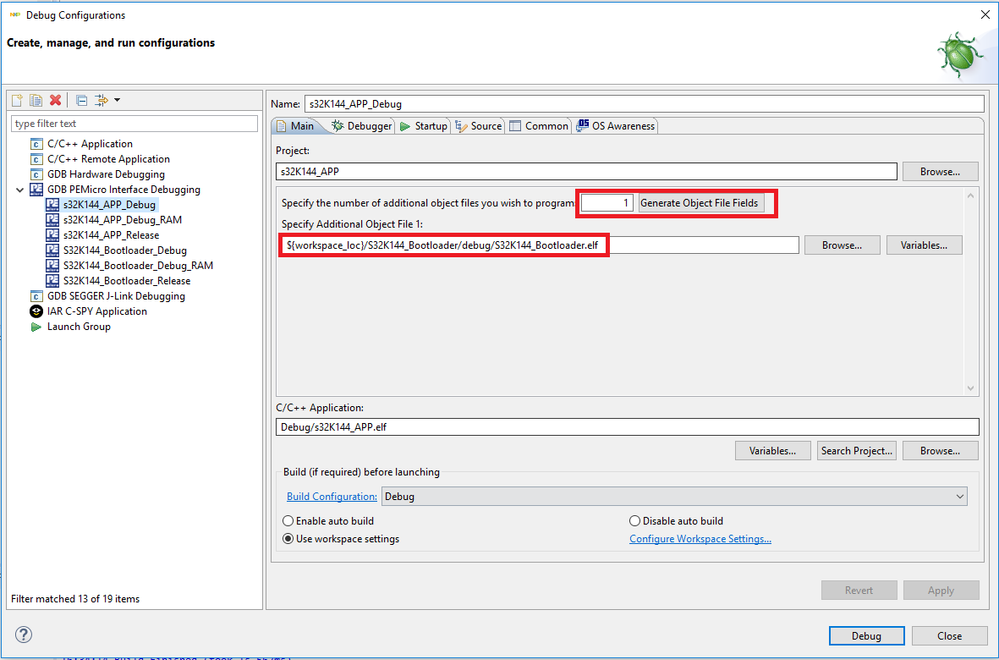
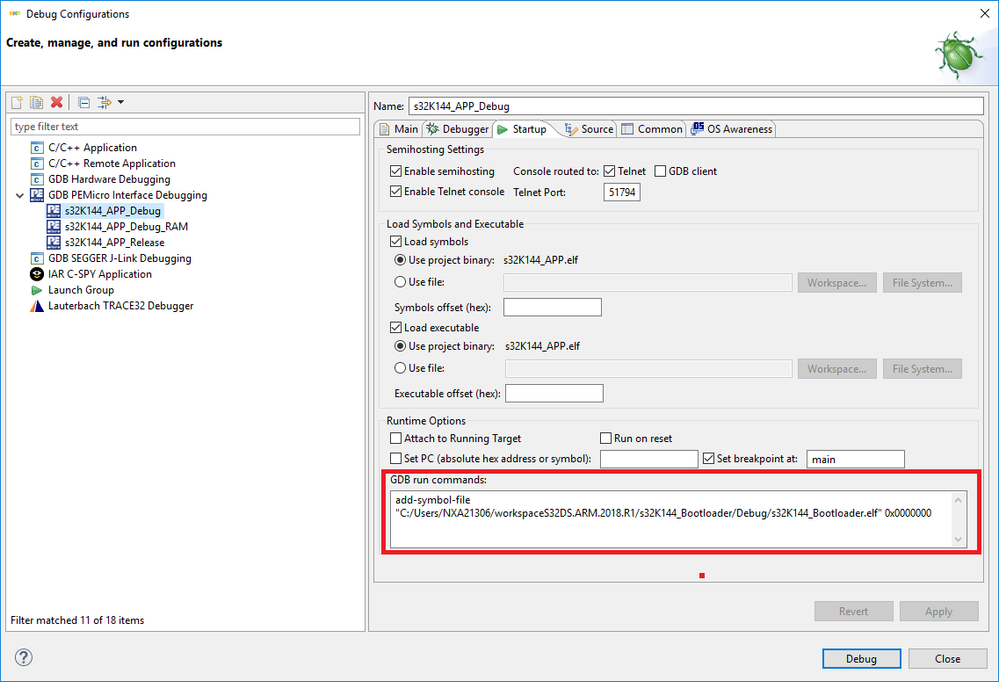
Before starting the debugger it's necessary to load both executable files into your MCU memory. This could be easily achieved in S32DS (GDB) debug configuration where you specify to add the additional object files.
In this specific case we need just 1 additional file - bootloader elf. The bootloader project in this example is actually another project in the same workspace (workspace relative path to elf file entered).
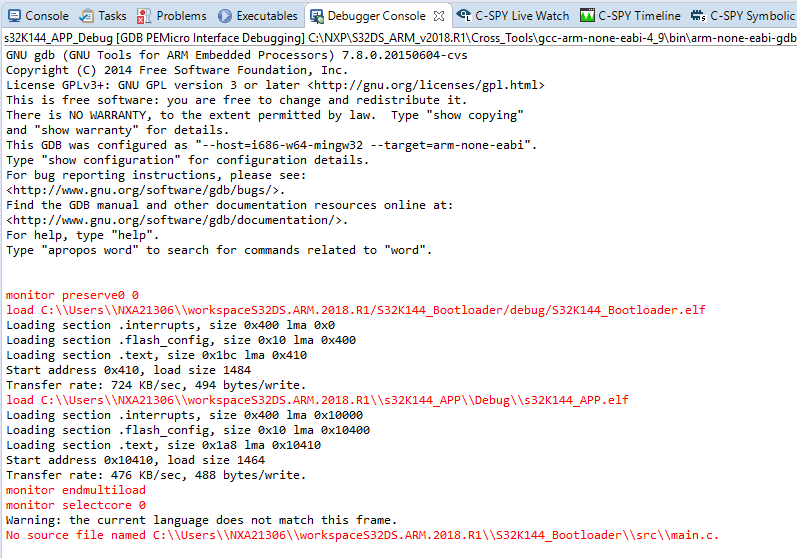
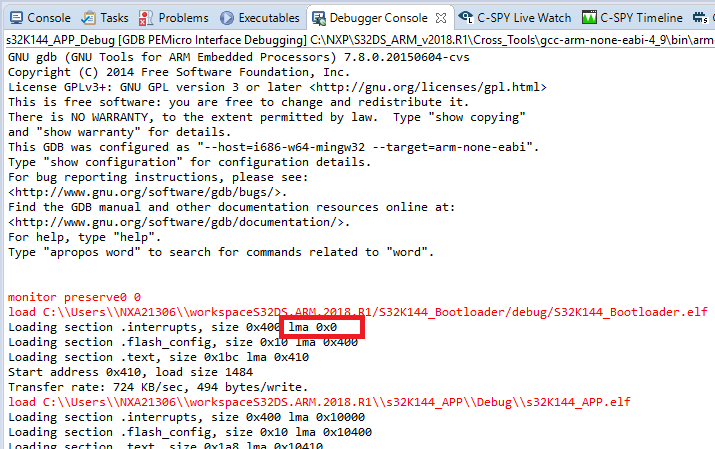
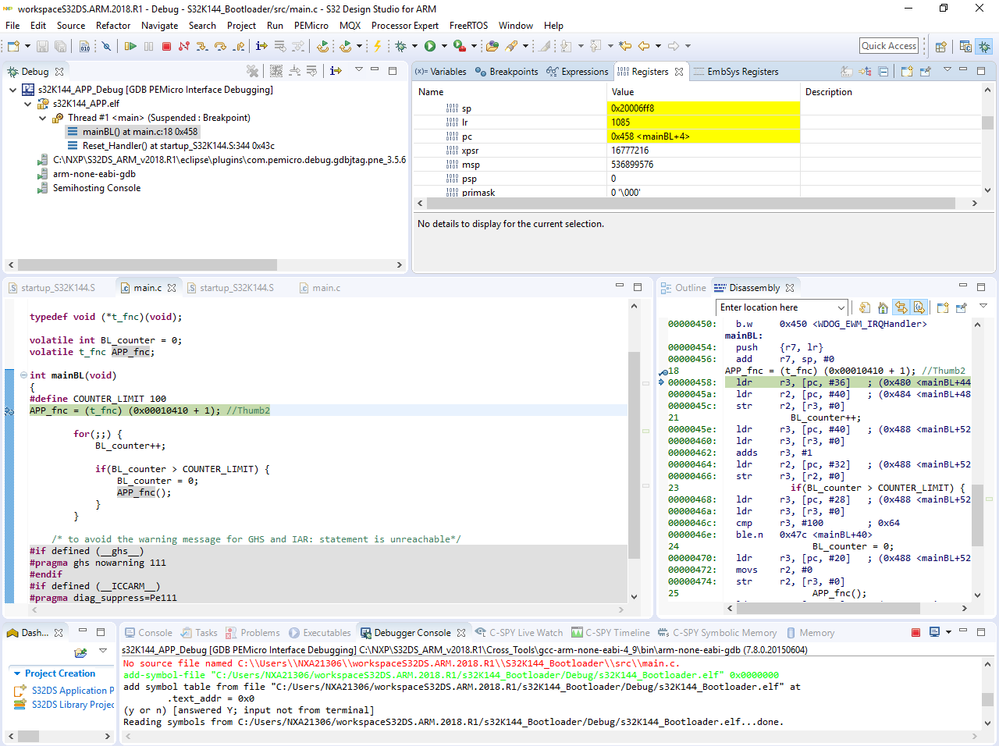
After starting debugger the Debugger Console view now shows the details about programming of two elf files instead of one including load address of each section.
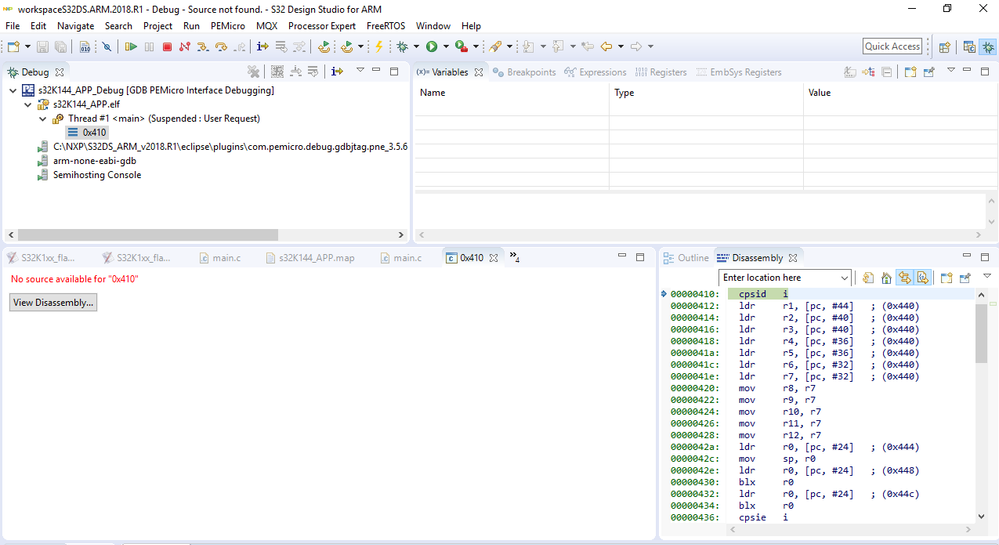
When loading is finished the debug information for bootloader is not yet available ("No source available..." message displayed in the source level debug view)
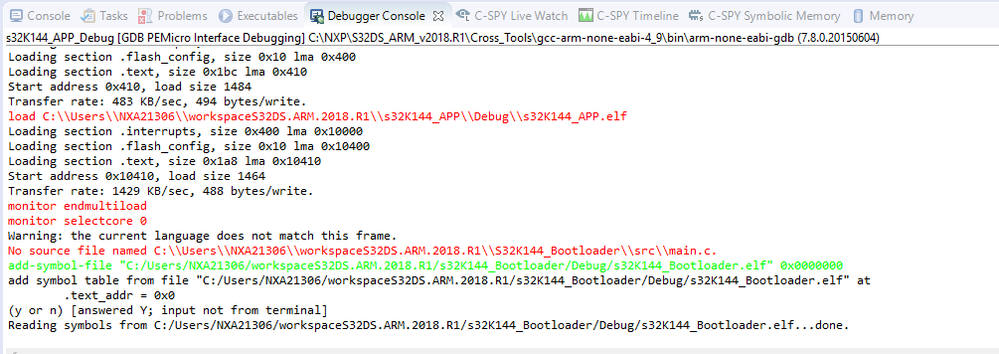
In order to display source and symbols for the bootloader elf please enter "add-symbol-file" GDB command into Debugger Console View:
add-symbol-file "C:/Users/NXA21306/workspaceS32DS.ARM.2018.R1/s32K144_Bootloader/Debug/s32K144_Bootloader.elf" 0x0000000The GDB client command could be executed automatically when launching a debug session:
The first argument is path to the elf file and the second argument (0x00000000) is the load address of the elf file (see the first bootloader load address ).
Finally the debug session needs to be refreshed in order to display changes from just added symbol file. The refresh can be forced by performing a single step or issuing the target reset from the debugger.
- Mark as Read
- Mark as New
- Bookmark
- Permalink
- Report Inappropriate Content
Hello Stanislav,
I really like your manual. Unfortunately I have to use a SEGGER J-link.
Can you provide a tutorial how to achieve the same result with a J-link debugger? I don't get the point where I can load the second .elf file...
Best regards,
Markus
- Mark as Read
- Mark as New
- Bookmark
- Permalink
- Report Inappropriate Content
In the step where you type GDB run commands, is possible that you have to type double bar (//) instead one /.
- Mark as Read
- Mark as New
- Bookmark
- Permalink
- Report Inappropriate Content
thank you very much!
