- Forums
- Product Forums
- General Purpose MicrocontrollersGeneral Purpose Microcontrollers
- i.MX Forumsi.MX Forums
- QorIQ Processing PlatformsQorIQ Processing Platforms
- Identification and SecurityIdentification and Security
- Power ManagementPower Management
- Wireless ConnectivityWireless Connectivity
- RFID / NFCRFID / NFC
- Advanced AnalogAdvanced Analog
- MCX Microcontrollers
- S32G
- S32K
- S32V
- MPC5xxx
- Other NXP Products
- S12 / MagniV Microcontrollers
- Powertrain and Electrification Analog Drivers
- Sensors
- Vybrid Processors
- Digital Signal Controllers
- 8-bit Microcontrollers
- ColdFire/68K Microcontrollers and Processors
- PowerQUICC Processors
- OSBDM and TBDML
- S32M
- S32Z/E
-
- Solution Forums
- Software Forums
- MCUXpresso Software and ToolsMCUXpresso Software and Tools
- CodeWarriorCodeWarrior
- MQX Software SolutionsMQX Software Solutions
- Model-Based Design Toolbox (MBDT)Model-Based Design Toolbox (MBDT)
- FreeMASTER
- eIQ Machine Learning Software
- Embedded Software and Tools Clinic
- S32 SDK
- S32 Design Studio
- GUI Guider
- Zephyr Project
- Voice Technology
- Application Software Packs
- Secure Provisioning SDK (SPSDK)
- Processor Expert Software
- Generative AI & LLMs
-
- Topics
- Mobile Robotics - Drones and RoversMobile Robotics - Drones and Rovers
- NXP Training ContentNXP Training Content
- University ProgramsUniversity Programs
- Rapid IoT
- NXP Designs
- SafeAssure-Community
- OSS Security & Maintenance
- Using Our Community
-
- Cloud Lab Forums
-
- Knowledge Bases
- ARM Microcontrollers
- i.MX Processors
- Identification and Security
- Model-Based Design Toolbox (MBDT)
- QorIQ Processing Platforms
- S32 Automotive Processing Platform
- Wireless Connectivity
- CodeWarrior
- MCUXpresso Suite of Software and Tools
- MQX Software Solutions
- RFID / NFC
- Advanced Analog
-
- NXP Tech Blogs
- Home
- :
- General Purpose Microcontrollers
- :
- Kinetis Microcontrollers
- :
- No port select available in setting a debugger connection.
No port select available in setting a debugger connection.
- Subscribe to RSS Feed
- Mark Topic as New
- Mark Topic as Read
- Float this Topic for Current User
- Bookmark
- Subscribe
- Mute
- Printer Friendly Page
- Mark as New
- Bookmark
- Subscribe
- Mute
- Subscribe to RSS Feed
- Permalink
- Report Inappropriate Content
Hello -
I too am getting this same error when trying to set up a connection in debug configure.
I also get a blank line on port select, and no refresh action.
" PE-ERROR: Unable to auto-detect debug hardware. Please specify on the command-line. Halting."
I am using Windows 7 Home Premium, new computer and first install of KDS - have tried KDS 2.0 and 1.1.1.
My FRDM-KL46Z board did load and show up properly.
I have downloaded and installed the PEMicro drivers multiple times - it seems to be installed.
Any hints would be great!
KenH
Solved! Go to Solution.
- Mark as New
- Bookmark
- Subscribe
- Mute
- Subscribe to RSS Feed
- Permalink
- Report Inappropriate Content
Hi,
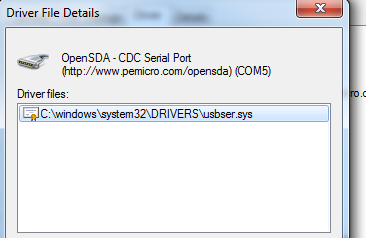
I just tested the same creating a new project for the KL46Z256 device. This is how the driver details look in my computer
Please check that your board has the latest firmware update. You can check the information of this link: Illustrated Step-by-Step Instructions: Updating the Freescale Freedom Board Firmware | MCU on Eclips...
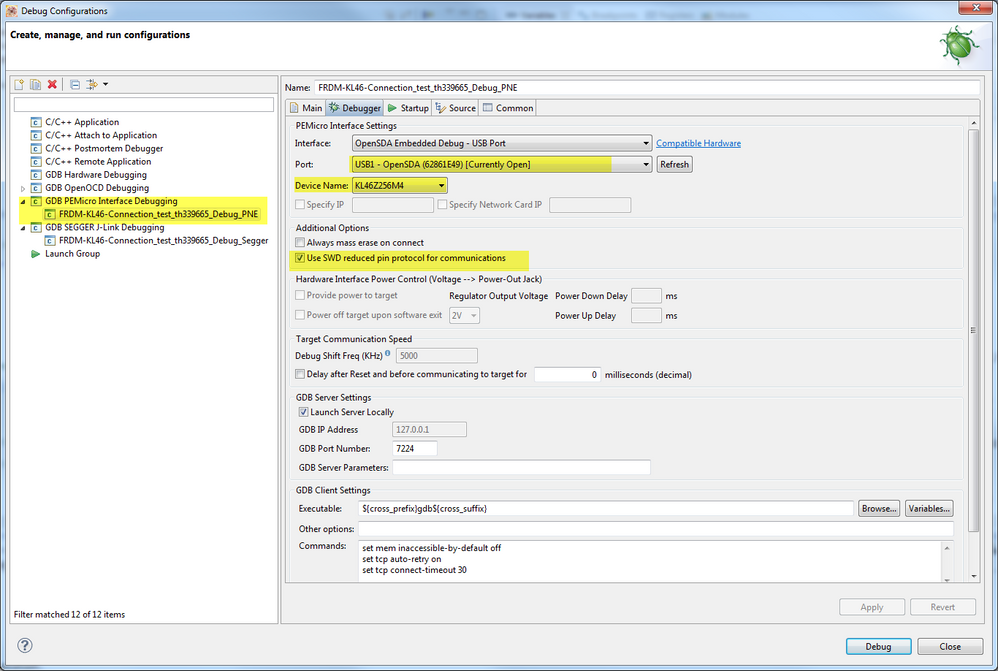
Here you can see my debug configurations:
Check the highlighted parameters on your configuration.
It is possible that you Antivirus is handling the device or the device's driver like a threat for the system, try to disable for a while this and reinstall the drivers. Also you can try to debug with the antivirus disabled.
Hope this information can help you
Best Regards,
Adrian Sanchez Cano
Technical Support Engineer
-----------------------------------------------------------------------------------------------------------------------
Note: If this post answers your question, please click the Correct Answer button. Thank you!
-----------------------------------------------------------------------------------------------------------------------
- Mark as New
- Bookmark
- Subscribe
- Mute
- Subscribe to RSS Feed
- Permalink
- Report Inappropriate Content
Hi,
You may find useful this post:
GDB Debugging with Kinetis Design Studio
Hope this information can help you
Best Regards,
Adrian Sanchez Cano
Technical Support Engineer
-----------------------------------------------------------------------------------------------------------------------
Note: If this post answers your question, please click the Correct Answer button. Thank you!
-----------------------------------------------------------------------------------------------------------------------
- Mark as New
- Bookmark
- Subscribe
- Mute
- Subscribe to RSS Feed
- Permalink
- Report Inappropriate Content
Hi Adrian -
Thanks for the link, but it doesn't have any procedures or hints that I don't already know.
Is there perhaps a more detailed error log that might point out my missteps?
I do see under my Windows device manager that a COM port does come up when I plug in the board.
It comes up as COM 3 or 4, and is setup with 9600 baud, etc. When I look at the driver details, I see the date (2009) but
not a version number. (from PEMicro).
device manager ports says: "OpenSDA-CDC Serial Port (http//www.pemicro.com/opensda)(COM3)"
I also just noticed that McAfee tries to do a scan of the board when I plug it in. I decline. Could that interfere with the connection?
Thanks,
Ken
- Mark as New
- Bookmark
- Subscribe
- Mute
- Subscribe to RSS Feed
- Permalink
- Report Inappropriate Content
Hi,
I just tested the same creating a new project for the KL46Z256 device. This is how the driver details look in my computer
Please check that your board has the latest firmware update. You can check the information of this link: Illustrated Step-by-Step Instructions: Updating the Freescale Freedom Board Firmware | MCU on Eclips...
Here you can see my debug configurations:
Check the highlighted parameters on your configuration.
It is possible that you Antivirus is handling the device or the device's driver like a threat for the system, try to disable for a while this and reinstall the drivers. Also you can try to debug with the antivirus disabled.
Hope this information can help you
Best Regards,
Adrian Sanchez Cano
Technical Support Engineer
-----------------------------------------------------------------------------------------------------------------------
Note: If this post answers your question, please click the Correct Answer button. Thank you!
-----------------------------------------------------------------------------------------------------------------------
- Mark as New
- Bookmark
- Subscribe
- Mute
- Subscribe to RSS Feed
- Permalink
- Report Inappropriate Content
Here is the console report:
P&E GDB Server, Version 5.13.02.00
Copyright 2014, P&E Microcomputer Systems Inc, All rights reserved
Loading library
C:\Freescale\KDS_2.0.0\eclipse\plugins\com.pemicro.debug.gdbjtag.pne_1.1.7.201410171532\win32\gdi\unit_ngs_arm_internal.dll
... Done.
Command line arguments: -device=KL46Z256M4 -startserver -singlesession
-serverport=7224 -interface=OPENSDA -speed=5000 -port=USB1
-USE_CYCLONEPRO_RELAYS=0 -FORCE_MASS_ERASE=0
Device selected is kl46z256m4
User Specified Hardware Selection : Interface=OPENSDA and Port=USB1
Connecting to target.
OpenSDA detected - Flash Version 1.14
Can not enter background mode .
Unable to initialize PEDebug.
PE-ERROR: Failed to Initialize Target
Server running on 127.0.0.1:7224
Connection from "127.0.0.1" via 127.0.0.1
PE-ERROR: Target is not connected
Disconnected from "127.0.0.1" via 127.0.0.1
Target Disconnected.
- Mark as New
- Bookmark
- Subscribe
- Mute
- Subscribe to RSS Feed
- Permalink
- Report Inappropriate Content
Hi Adrian -
Can I still get your help on this failure to launch problem on this thread?
Or should I start another question?
I see that "Can not enter background mode" has been a problem for other people as well
and that I maybe should try a new project.
Thanks,
Ken
- Mark as New
- Bookmark
- Subscribe
- Mute
- Subscribe to RSS Feed
- Permalink
- Report Inappropriate Content
Hi Adrian -
The updated bootloader may have helped. I now get the proper selection in
the port menu.
I get further into the launch, but then get:
Error in Final Launch Sequence
Failed to execute MI command
Target disconnected : No Error
At least that is a more familiar error, although I forgot what it means.
Maybe an improperly terminated previous connection or a zombie.
- Mark as New
- Bookmark
- Subscribe
- Mute
- Subscribe to RSS Feed
- Permalink
- Report Inappropriate Content
Hi Adrian -
Thanks for your settings.
My settings on the driver are the same as yours.
On the debug config, mine are the same except for the blank port window.
Also, on the bottom, I have a check box labelled "Force thread list update
on suspend" . I suppose I have a slightly different version.
After I deleted McAfee, I now get "Windows firewall has blocked some
features" as soon as click on the Debugger tab.
Firewall did let me have access, but maybe I should try to turn off or
delete the firewall.
There must be a log somewhere that tells the interface setup between KDS
and Windows. 7 home premium probably has something unusual.
Ken
On Tue, Jan 20, 2015 at 3:23 PM, Adrian Sanchez Cano <

