
- Forums
- Product Forums
- General Purpose MicrocontrollersGeneral Purpose Microcontrollers
- i.MX Forumsi.MX Forums
- QorIQ Processing PlatformsQorIQ Processing Platforms
- Identification and SecurityIdentification and Security
- Power ManagementPower Management
- MCX Microcontrollers
- S32G
- S32K
- S32V
- MPC5xxx
- Other NXP Products
- Wireless Connectivity
- S12 / MagniV Microcontrollers
- Powertrain and Electrification Analog Drivers
- Sensors
- Vybrid Processors
- Digital Signal Controllers
- 8-bit Microcontrollers
- ColdFire/68K Microcontrollers and Processors
- PowerQUICC Processors
- OSBDM and TBDML
-
- Solution Forums
- Software Forums
- MCUXpresso Software and ToolsMCUXpresso Software and Tools
- CodeWarriorCodeWarrior
- MQX Software SolutionsMQX Software Solutions
- Model-Based Design Toolbox (MBDT)Model-Based Design Toolbox (MBDT)
- FreeMASTER
- eIQ Machine Learning Software
- Embedded Software and Tools Clinic
- S32 SDK
- S32 Design Studio
- GUI Guider
- Zephyr Project
- Voice Technology
- Application Software Packs
- Secure Provisioning SDK (SPSDK)
- Processor Expert Software
- MCUXpresso Training Hub
-
- Topics
- Mobile Robotics - Drones and RoversMobile Robotics - Drones and Rovers
- NXP Training ContentNXP Training Content
- University ProgramsUniversity Programs
- Rapid IoT
- NXP Designs
- SafeAssure-Community
- OSS Security & Maintenance
- Using Our Community
-
- Cloud Lab Forums
-
- Knowledge Bases
Hello,
I am working on S32K144 EVB.I was checking one of the programs developed using SDK, used micro USB(Open SDA) for flashing and successfully flashed the code.
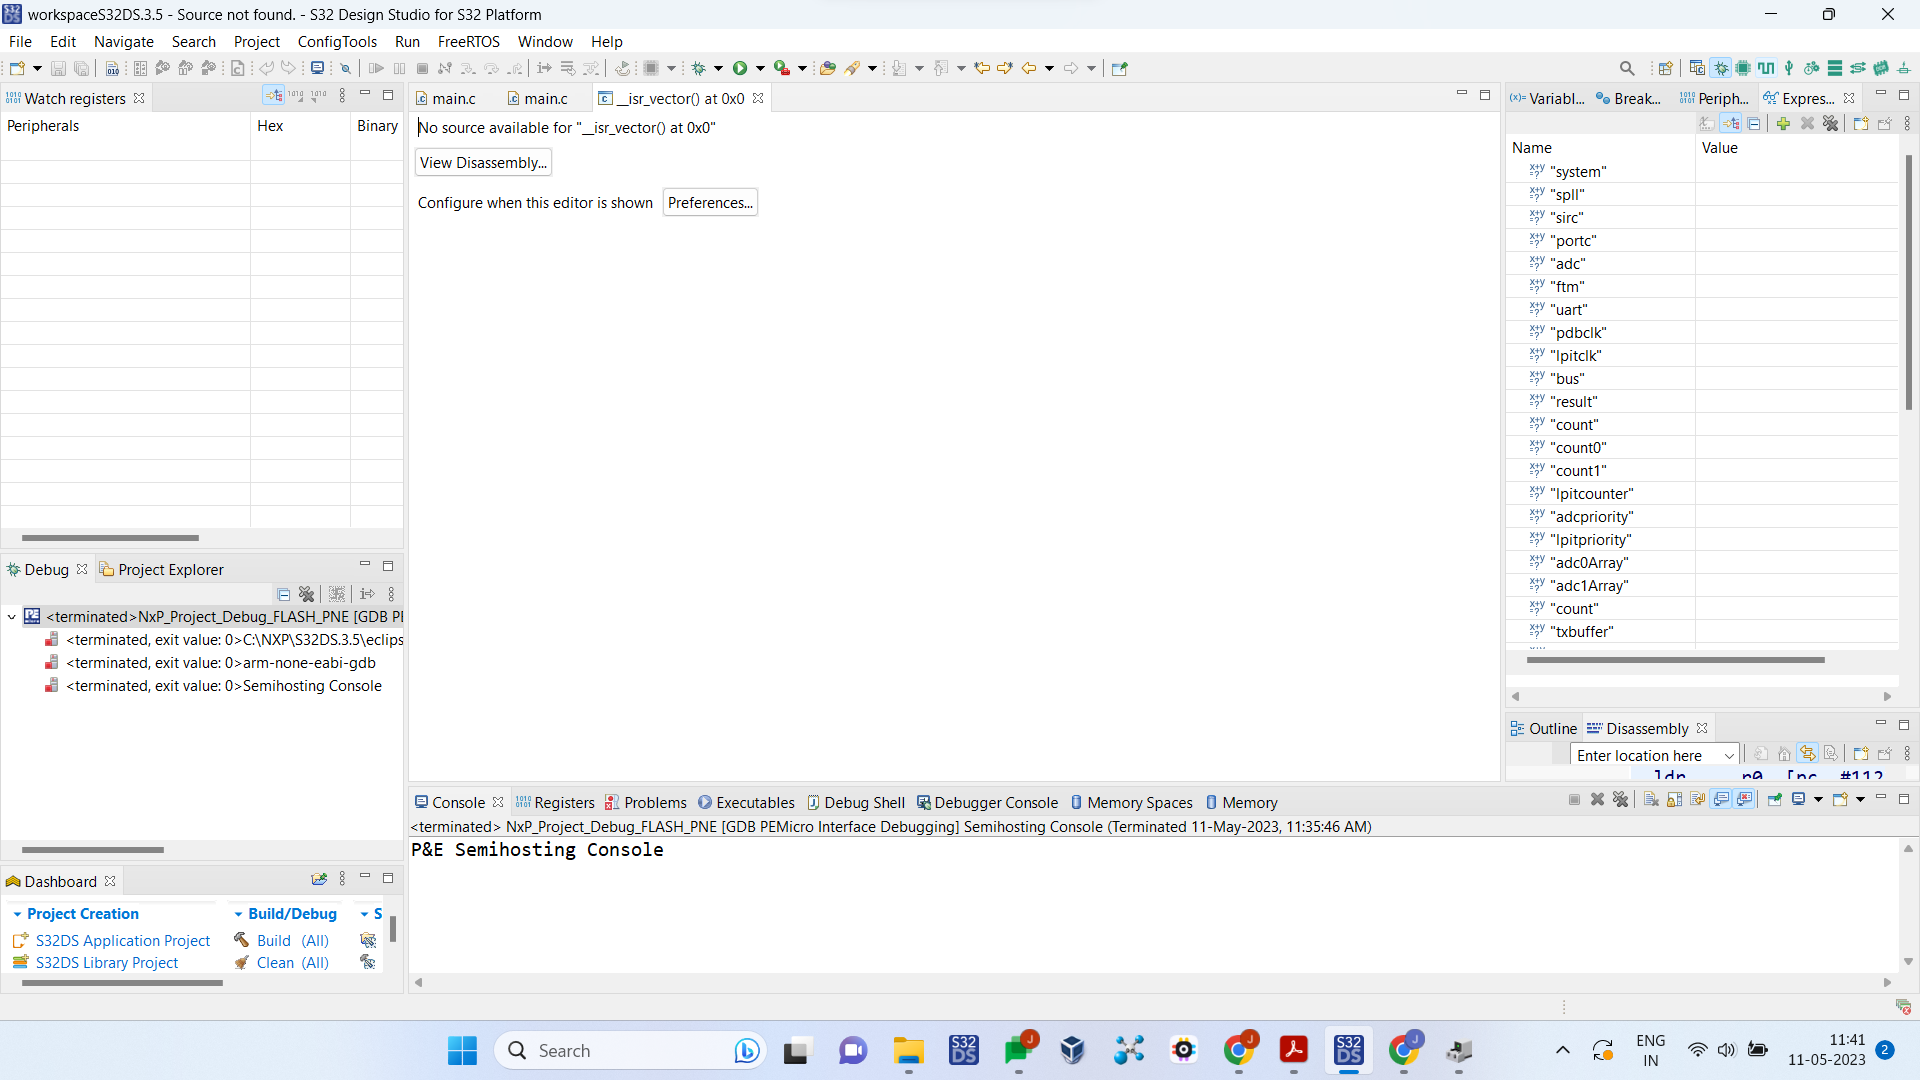
But after running in the debug window, the program suddenly tried to enter an ISR with vector address 0x00 and the reset LED is continuously turned ON in the board.
I've attached the debug window image and eval board image where the program halted first time.
>When i tried flashing any other project again, debug error is occuring, seems like i cannot debug any code now.

>I entered the board in bootloader mode and checked application version, it is up to date. No need to update the firmware.

Actually this is the second board which got corrupted one after the other in the same way.
Can someone help me resolve this issue, can my boards be recovered?
>I am using S32DS platform v3.5
>Eval board version - SCH-29248 REV C1
已解决! 转到解答。
This is because you reconfigured the JTAG/SWD pins and the reset_b pin to other functions.

Once the pins are initialize in the project, the debugger cannot use them.
You need to power-cycle the MCU and attach the debugger in the short window before it gets reconfigured.
You can use the PE Micro Kinetis Recovery Tool

https://www.pemicro.com/support/download_processor.cfm?type=5
But as far as I know, it does not work with the OpenSDA debugger.
BR, Daniel
Thanks for the reply.
1.Now the error message is like this

2. I Don't have any other debugger right now.
3. In the project I have used ports for pin configurations like GPIO,ADC,FTM etc. and nothing else, I had not programmed any other peripheral yet. I have attached the pin configuration code below.
4. I have not used CSEc.
5. yes, both reset and RGB LED have turned ON.
This is because you reconfigured the JTAG/SWD pins and the reset_b pin to other functions.
Once the pins are initialize in the project, the debugger cannot use them.
You need to power-cycle the MCU and attach the debugger in the short window before it gets reconfigured.
You can use the PE Micro Kinetis Recovery Tool
https://www.pemicro.com/support/download_processor.cfm?type=5
But as far as I know, it does not work with the OpenSDA debugger.
BR, Daniel
Hey @danielmartynek,
Thanks for finding the cause.
"You need to power-cycle the MCU and attach the debugger in the short window before it gets reconfigured."
Can you please help me understand this better?
Hello @Jeevansagar,
To reset the JTAG/SWD and Reset_b pins to have their default functions, you need to reset the MCU.
The only reset you can trigger now is a power-on reset (POR).
There is a short time window after each POR during which the debugger can be connected.
The window is closed by the application that changes the pins to GPIO again.
Regards,
Daniel
Hi @Jeevansagar,
A few questions.
What error message do you get from the debugger now?
Do you have any other debugger?
What project was loaded to the board before the failure?
Is the CSEc enabled?
In the image of the EVB, it seems like the reset LED is ON as well as the RGB LED, is it so?

Thank you,
BR, Daniel