
- Forums
- Product Forums
- General Purpose MicrocontrollersGeneral Purpose Microcontrollers
- i.MX Forumsi.MX Forums
- QorIQ Processing PlatformsQorIQ Processing Platforms
- Identification and SecurityIdentification and Security
- Power ManagementPower Management
- Wireless ConnectivityWireless Connectivity
- RFID / NFCRFID / NFC
- Advanced AnalogAdvanced Analog
- Neural Processing UnitsNeural Processing Units
- MCX Microcontrollers
- S32G
- S32K
- S32V
- MPC5xxx
- Other NXP Products
- S12 / MagniV Microcontrollers
- Powertrain and Electrification Analog Drivers
- Sensors
- Vybrid Processors
- Digital Signal Controllers
- 8-bit Microcontrollers
- ColdFire/68K Microcontrollers and Processors
- PowerQUICC Processors
- OSBDM and TBDML
- S32M
- S32Z/E
-
- Solution Forums
- Software Forums
- MCUXpresso Software and ToolsMCUXpresso Software and Tools
- CodeWarriorCodeWarrior
- MQX Software SolutionsMQX Software Solutions
- Model-Based Design Toolbox (MBDT)Model-Based Design Toolbox (MBDT)
- FreeMASTER
- eIQ Machine Learning Software
- Embedded Software and Tools Clinic
- S32 SDK
- S32 Design Studio
- GUI Guider
- Zephyr Project
- Voice Technology
- Application Software Packs
- Secure Provisioning SDK (SPSDK)
- Processor Expert Software
- Generative AI & LLMs
-
- Topics
- Mobile Robotics - Drones and RoversMobile Robotics - Drones and Rovers
- NXP Training ContentNXP Training Content
- University ProgramsUniversity Programs
- Rapid IoT
- NXP Designs
- SafeAssure-Community
- OSS Security & Maintenance
- Using Our Community
-
- Cloud Lab Forums
-
- Knowledge Bases
- ARM Microcontrollers
- i.MX Processors
- Identification and Security
- Model-Based Design Toolbox (MBDT)
- QorIQ Processing Platforms
- S32 Automotive Processing Platform
- Wireless Connectivity
- CodeWarrior
- MCUXpresso Suite of Software and Tools
- MQX Software Solutions
- RFID / NFC
- Advanced Analog
- Neural Processing Units
-
- NXP Tech Blogs
- Home
- :
- Product Forums
- :
- Powertrain and Electrification Analog Drivers
- :
- PT2000 trace module error
PT2000 trace module error
- Subscribe to RSS Feed
- Mark Topic as New
- Mark Topic as Read
- Float this Topic for Current User
- Bookmark
- Subscribe
- Mute
- Printer Friendly Page
PT2000 trace module error
- Mark as New
- Bookmark
- Subscribe
- Mute
- Subscribe to RSS Feed
- Permalink
- Report Inappropriate Content
I am attempting to debug some PT2000 firmware that I wrote. This is a prototype board using a PT2000 to drive some H-bridges.
When I attempt to capture a trace, the console that pops up shows the following messages.
***** begin console message
Asic Tracer 2.0.0.0
8/9/2021 10:49:21 AM
Asic Compiler 3.3.0.0
Compiling code from file c:\svn\jvs-jvcb3\trunk\hardware\pt2000\pt2000_design_studio_project\microcodech3\ch3.psc
Asic instruction set from file C:\Program Files (x86)\NXP\PT2000DevStudio\syntax_pt2000.xml
Syntax file version 1.9.2 of 23 Jun 2015
Writing report file:
c:\svn\jvs-jvcb3\trunk\hardware\pt2000\pt2000_design_studio_project\microcodech3\ch3.rep
Writing binary file:
c:\svn\jvs-jvcb3\trunk\hardware\pt2000\pt2000_design_studio_project\microcodech3\ch3.bin
Writing hexadecimal file:
c:\svn\jvs-jvcb3\trunk\hardware\pt2000\pt2000_design_studio_project\microcodech3\ch3.hex
Writing Trace 32 file:
c:\svn\jvs-jvcb3\trunk\hardware\pt2000\pt2000_design_studio_project\microcodech3\ch3.t32
Writing Trace metadata:
c:\svn\jvs-jvcb3\trunk\hardware\pt2000\pt2000_design_studio_project\microcodech3\ch3.trace.dat
Microcode metadata read from c:\svn\jvs-jvcb3\trunk\hardware\pt2000\pt2000_design_studio_project\microcodech3\ch3.trace.dat
Device under test is pt2000
Saturn tracer board detected
HW version 1.0
Reading data from port
Press 'q' to abort operation at any time
Trace Start
Fw version 2.1
First Data received
881676
Trace Stop
Acquisition Complete
Decoding content of file c:\svn\jvs-jvcb3\trunk\hardware\pt2000\pt2000_design_studio_project\tracer\stream.dat
Decoding stream recorded from Saturn 1.0 tracer board
Tracer board FW version 2.0
Clock cycles acquired in the trace operation: 4193957
Decoding operation stopped after 41 steps:
Unexpected Code : code 5 is not legal for instruction at line 570
Are you sure you want to exit [Y]?
***** end of console message
The path.txt file shows:
***** begin path.txt
529 X 1
530 X 1
531 X 1
532 X 1
533 X 1
534 X 1
535 X 1
536 X 1
537 X 1
538 X 1
539 X 1
540 X 1
541 X 1
542 X 1
543 X 1
544 X 1
545 X 1
546 X 1
547 X 1
548 X 1
549 X 1
550 X 1
551 X 1
552 X 1
553 X 1
554 X 1
555 X 1
556 X 1
557 X 1
558 X 1
559 X 1
560 X 1
561 X 1
562 X 1
563 X 1
564 X 1
565 X 1
566 X 1
567 X 1
568 X 1
569 X 1
570 X 1
***** end path.txt
Here's the screen grab from developer studio. 0x23A is a jump relative command.

The prototype PCB is using a 1.5" 50-ohm Z0 trace between the PT2000 and the BNC connector. I'm using a 6" 50-ohm BNC cable to connect the trace module to the PCB. I attempted to hook up an oscope to examine signal quality, but putting a T-connector and scope extension caused the trace module to error out on the first sample, unsurprisingly.
This issue is very repeatable.
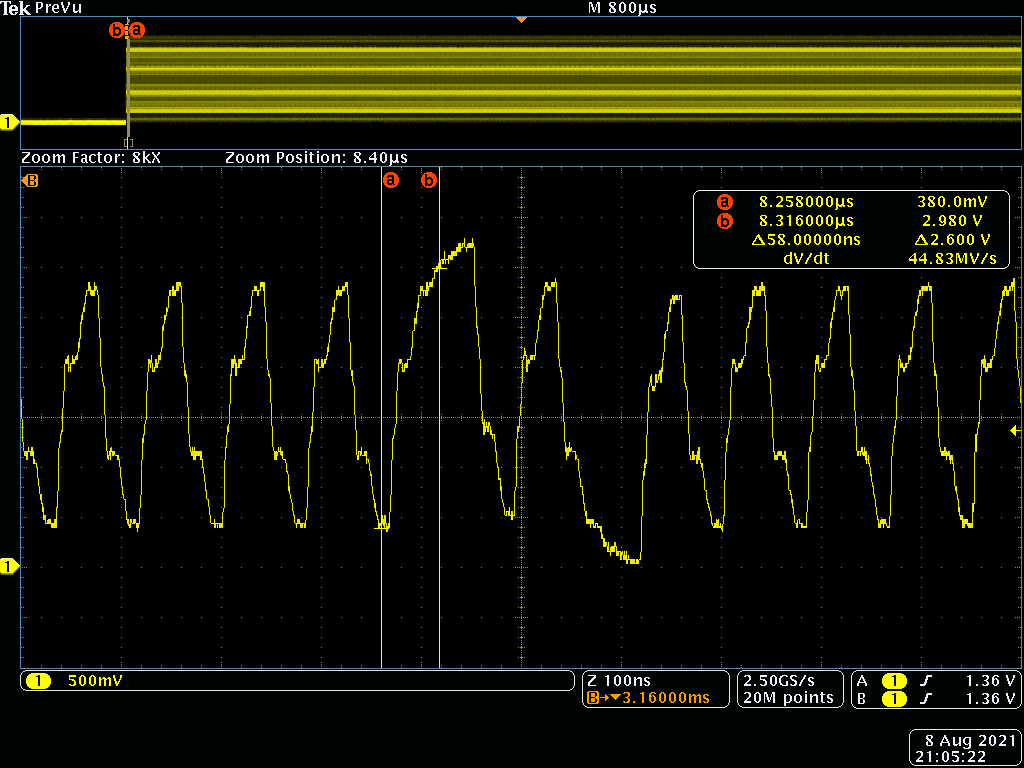
I attempted to sample the debug cable to see if I had SI issues. I used a 3' cable to a T-connector on the oscilloscope, then a 6" cable from the tee to the trace capture card. The scope capture is attached. Based on the layout, it seems that the KITPSCEVM tracer module may not be terminated.
I attempted to put the oscope on the end of the bus (6" from prototype board to tee, (tee connected directly to trace module) and 3' from tee to oscope) and turn on 50-ohm termination on the oscope, but the trace module didn't even start a capture when I did that.
Am I having SI issues here, or is there a problem with my trace setup or the trace software? Trace configuration is as shows.

- Mark as New
- Bookmark
- Subscribe
- Mute
- Subscribe to RSS Feed
- Permalink
- Report Inappropriate Content
This code is running on a prototype solenoid driver board, not the NXP demo board. The NXP demo board was never used in the development, as our board is driving 3x H-bridges as well as high and low side supply rails shutoffs for the bridges, and has next to nothing in common with the dev board's schematic.
As such, the value of the full project is of limited use without the accompanying PCB. I'd rather not go through all the NDA stuff unless its determined that it is needed to diagnose the issue.
Attached is a zip file for the trace being run.
Here is a shot of the trace configuration

Code from 0x008 - 0x028:

code from 0x028 - 0x041 (note that the trace aborts at the jump at 0x038, and the previous step loaded the address into JR1 so the trace module shouldn't have any problem realizing that code is passing to post_step_2 @ 0x043

- Mark as New
- Bookmark
- Subscribe
- Mute
- Subscribe to RSS Feed
- Permalink
- Report Inappropriate Content

- Mark as New
- Bookmark
- Subscribe
- Mute
- Subscribe to RSS Feed
- Permalink
- Report Inappropriate Content
I'd also like to add, that this path.txt trace seems to be mostly incorrect, as there are subroutine calls at 0x10, 0x30, and 0x32 which are not showing up in the path. The busy loop in 0x2C may or may not be taken as it is likely that the other channels start executing code earlier and the rail power may already be on.
- Mark as New
- Bookmark
- Subscribe
- Mute
- Subscribe to RSS Feed
- Permalink
- Report Inappropriate Content
Hi Glenn, some comments from internal apps team:
Looking at error code I would think it is more a code issue.
Can they try a code example from the web and see if the trace is also failing?
Or even change their code to the minimum to see if a trace can be completed?
Can your customer send us their full project in order to see if the code is ok or if there is some error?
- Mark as New
- Bookmark
- Subscribe
- Mute
- Subscribe to RSS Feed
- Permalink
- Report Inappropriate Content
here are some comments/questions from the trace developer.
There could be a number of issues:
- Does tracing fails (with a specific setup) all the time? Or only sometimes? If the answer is sometimes, it probably is a SI issues, otherwise we should look at the setup
- It could be due to mis-alignment of tracer input to PT2000 inputs:
- Check that the registers (tracer_start/stop/config/entrypoint/ISR_addresses) are configured in the PT2000 in the same way as the tracer configuration (this is the cause of 90% of the failure I had with the tracer L )
- Code file supplied to the tracer is the same as the one downloaded in the PT2000? It should be in case SPIgen is used, but better check
- There are multiple PT2000 on the board? Is the correct one being traced?