- NXP Forums
- Product Forums
- General Purpose MicrocontrollersGeneral Purpose Microcontrollers
- i.MX Forumsi.MX Forums
- QorIQ Processing PlatformsQorIQ Processing Platforms
- Identification and SecurityIdentification and Security
- Power ManagementPower Management
- MCX Microcontrollers
- S32G
- S32K
- S32V
- MPC5xxx
- Other NXP Products
- Wireless Connectivity
- S12 / MagniV Microcontrollers
- Powertrain and Electrification Analog Drivers
- Sensors
- Vybrid Processors
- Digital Signal Controllers
- 8-bit Microcontrollers
- ColdFire/68K Microcontrollers and Processors
- PowerQUICC Processors
- OSBDM and TBDML
-
- Solution Forums
- Software Forums
- MCUXpresso Software and ToolsMCUXpresso Software and Tools
- CodeWarriorCodeWarrior
- MQX Software SolutionsMQX Software Solutions
- Model-Based Design Toolbox (MBDT)Model-Based Design Toolbox (MBDT)
- FreeMASTER
- eIQ Machine Learning Software
- Embedded Software and Tools Clinic
- S32 SDK
- S32 Design Studio
- Vigiles
- GUI Guider
- Zephyr Project
- Voice Technology
- Application Software Packs
- Secure Provisioning SDK (SPSDK)
- Processor Expert Software
-
- Topics
- Mobile Robotics - Drones and RoversMobile Robotics - Drones and Rovers
- NXP Training ContentNXP Training Content
- University ProgramsUniversity Programs
- Rapid IoT
- NXP Designs
- SafeAssure-Community
- OSS Security & Maintenance
- Using Our Community
-
- Cloud Lab Forums
-
- Home
- :
- MCUXpresso软件和工具
- :
- MCUXpresso IDE
- :
- MCUX v11.1.1 slow debug performance
MCUX v11.1.1 slow debug performance
MCUX v11.1.1 slow debug performance
I've been busy with other things thanks to COVID-19 and haven't been working on firmware much since MCUX v11.1.1 came out, but I'm putting in some time now and I'm having a heck of a time getting the debugger to perform. Here's a quick video showing some issues: Dropbox - 2020-05-06 10-06-36.mp4 - Simplify your life
I'm using a P&E Cyclone ACP connected via Ethernet. Firmware and plug-ins are up to date. As you can see in the video, the debugger initially works as it stops on a breakpoint, and from there it gets slower and slower. Hovering over a variable doesn't give its contents anymore, and the variables and global variables views stop refreshing and stop displaying even names.
Incidentally that's something it's done sometimes since at least CodeWarrior 10. It's common to have a tree with arrows to expand branches but it doesn't ever display names or contents.
After stepping through a few lines, the system just stops responding and there's nothing to be done except to stop the debug session.
How do I fix this? And what's the best place to look for relevant logs to see what's going on?
Thanks,
Scott
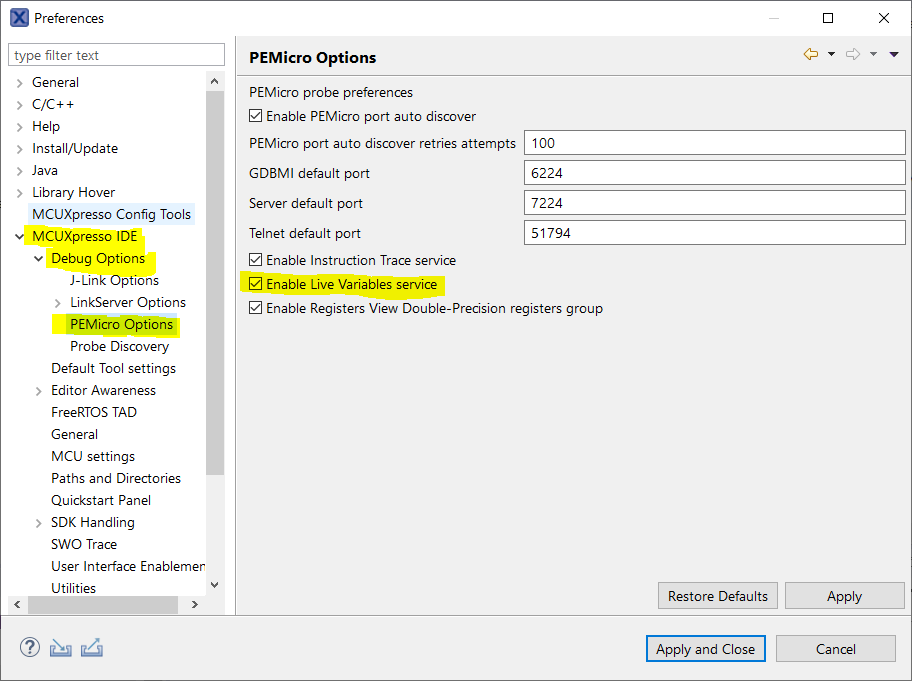
I suspect the "live variables" service responsible for the described behavior. You could try disabling it (see screenshot) and report back whether it fixes the problems. Please also attach GDB traces.
Greetings,
MCUXpresso IDE Support
Hello Scott,
Hope you are doing well.
Unfortunately, I was not able to open the link that you provided. If possible please try to attach it to the post directly. Can you confirm the OS that you are working with?
The .log is located in the metadata folder in your workspace.
Have you tried with a different device to see if the behavior only occurs when using the P&E Debug probe?
Once you have found the .log file please attach it here as well, so I can check it with detail.
Best Regards,
Sabina
-----------------------------------------------------------------------------------------------------------------------
Note: If this post answers your question, please click the Correct Answer button. Thank you!
-----------------------------------------------------------------------------------------------------------------------
Hi Sabina,
I'm using Windows 10 Enterprise. I tried my LPC-Link2 as well, with even worse results - though I don't remember the specific error right now.
I ended up deleting my debug launch configuration and recreating it, and that seems to have me going again. I'll let you know when it starts doing it again.
Regards,
Scott
