
- Forums
- Product Forums
- General Purpose MicrocontrollersGeneral Purpose Microcontrollers
- i.MX Forumsi.MX Forums
- QorIQ Processing PlatformsQorIQ Processing Platforms
- Identification and SecurityIdentification and Security
- Power ManagementPower Management
- Wireless ConnectivityWireless Connectivity
- RFID / NFCRFID / NFC
- Advanced AnalogAdvanced Analog
- Neural Processing UnitsNeural Processing Units
- MCX Microcontrollers
- S32G
- S32K
- S32V
- MPC5xxx
- Other NXP Products
- S12 / MagniV Microcontrollers
- Powertrain and Electrification Analog Drivers
- Sensors
- Vybrid Processors
- Digital Signal Controllers
- 8-bit Microcontrollers
- ColdFire/68K Microcontrollers and Processors
- PowerQUICC Processors
- OSBDM and TBDML
- S32M
- S32Z/E
-
- Solution Forums
- Software Forums
- MCUXpresso Software and ToolsMCUXpresso Software and Tools
- CodeWarriorCodeWarrior
- MQX Software SolutionsMQX Software Solutions
- Model-Based Design Toolbox (MBDT)Model-Based Design Toolbox (MBDT)
- FreeMASTER
- eIQ Machine Learning Software
- Embedded Software and Tools Clinic
- S32 SDK
- S32 Design Studio
- GUI Guider
- Zephyr Project
- Voice Technology
- Application Software Packs
- Secure Provisioning SDK (SPSDK)
- Processor Expert Software
- Generative AI & LLMs
-
- Topics
- Mobile Robotics - Drones and RoversMobile Robotics - Drones and Rovers
- NXP Training ContentNXP Training Content
- University ProgramsUniversity Programs
- Rapid IoT
- NXP Designs
- SafeAssure-Community
- OSS Security & Maintenance
- Using Our Community
-
- Cloud Lab Forums
-
- Knowledge Bases
- ARM Microcontrollers
- i.MX Processors
- Identification and Security
- Model-Based Design Toolbox (MBDT)
- QorIQ Processing Platforms
- S32 Automotive Processing Platform
- Wireless Connectivity
- CodeWarrior
- MCUXpresso Suite of Software and Tools
- MQX Software Solutions
- RFID / NFC
- Advanced Analog
- Neural Processing Units
-
- NXP Tech Blogs
- Home
- :
- MCUXpressoソフトウェアとツール
- :
- MCUXpresso 一般
- :
- Re: Debugger Losing Connection, Symbols, or... ?
Debugger Losing Connection, Symbols, or... ?
- RSS フィードを購読する
- トピックを新着としてマーク
- トピックを既読としてマーク
- このトピックを現在のユーザーにフロートします
- ブックマーク
- 購読
- ミュート
- 印刷用ページ
Debugger Losing Connection, Symbols, or... ?
- 新着としてマーク
- ブックマーク
- 購読
- ミュート
- RSS フィードを購読する
- ハイライト
- 印刷
- 不適切なコンテンツを報告
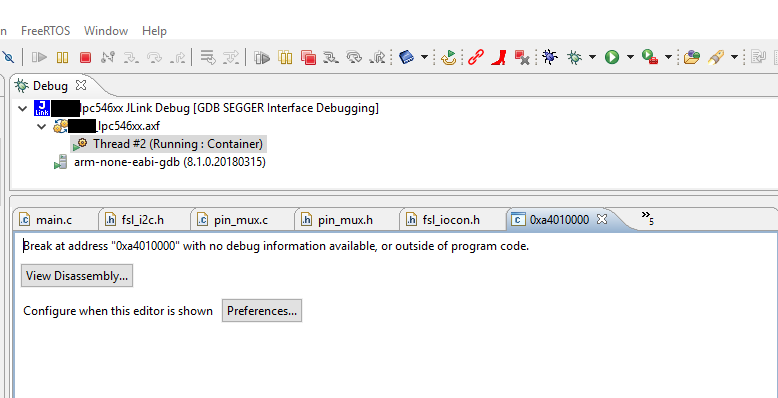
I've been working with MCUXpresso for a while now, and this problem has been a recurring one... Occasionally when debugging, the target is flashed successfully, but then the debugger looses connection or otherwise does not know what is going on. I see something like the attached screenshot. This is happening on my custom hardware as well as the development board OM13092 (LPC54608).
Until recently, I was primarily using the LPC-Link 2 with the CMSIS-DAP probe firmware. Recently, I decided to try changing to SEGGER J-Link. This problem occurs with both.
The most fustrating thing is that this behavior seems to be random. It is usually fixed by some combination of:
- Power cycle LPC-Link 2
- Power cycle Target
- Run "Clean Up Debug" in MCUXpresso IDE
- Close MCUXpresso IDE
Currently using MCUXpresso IDE v10.3.0
I'll also point out here that I recently found and followed the guidance provided in this article on thread-aware FreeRTOS debugging:
Troubleshooting Tips for FreeRTOS Thread Aware Debugging in Eclipse | MCU on Eclipse
- 新着としてマーク
- ブックマーク
- 購読
- ミュート
- RSS フィードを購読する
- ハイライト
- 印刷
- 不適切なコンテンツを報告
Thank you for the post and astute observation. Yes, there is off chip RAM but it it is located at 0xa0000000 with size of 0x1000000. After further review I found this in the debugger console:
...
Downloading 10116 bytes @ address 0x1028ED10 - Verified OK
J-Link: Flash download: Bank 0 @ 0x00000000: Skipped. Contents already match
J-Link: Flash download: Bank 1 @ 0x10000000: Skipped. Contents already match
Writing register (PC = 0xa4010000)
Reading all registers
WARNING: Failed to read memory @ address 0xA4010000
Read 4 bytes @ address 0x03000CAA (Data = 0x2DE9F041)
Read 2 bytes @ address 0x03000CAA (Data = 0x2DE9)...
For whatever reason, my launch configuration was setup for big endian. It was trying to set PC to 0xa4010000 instead of 0x1a4. I still don't understand how it would sometimes work with this incorrect setting?
- 新着としてマーク
- ブックマーク
- 購読
- ミュート
- RSS フィードを購読する
- ハイライト
- 印刷
- 不適切なコンテンツを報告
That address (0xa4010000) is in off chip ram - do you have any? Whatever, it is outside your application so the debugger has no information to display.
my guess is some memory corruption- most likely stack. You probably should closely examine your code to see if you can find where you have an overflowing buffer or an uninitialised pointer.
errors like this are really difficult to track down, because they appear random.
i think it is highly unlikely that there is a hardware or debugger problem - almost certainly it is a software problem.
good luck