- Forums
- Product Forums
- General Purpose MicrocontrollersGeneral Purpose Microcontrollers
- i.MX Forumsi.MX Forums
- QorIQ Processing PlatformsQorIQ Processing Platforms
- Identification and SecurityIdentification and Security
- Power ManagementPower Management
- Wireless ConnectivityWireless Connectivity
- RFID / NFCRFID / NFC
- Advanced AnalogAdvanced Analog
- MCX Microcontrollers
- S32G
- S32K
- S32V
- MPC5xxx
- Other NXP Products
- S12 / MagniV Microcontrollers
- Powertrain and Electrification Analog Drivers
- Sensors
- Vybrid Processors
- Digital Signal Controllers
- 8-bit Microcontrollers
- ColdFire/68K Microcontrollers and Processors
- PowerQUICC Processors
- OSBDM and TBDML
- S32M
- S32Z/E
-
- Solution Forums
- Software Forums
- MCUXpresso Software and ToolsMCUXpresso Software and Tools
- CodeWarriorCodeWarrior
- MQX Software SolutionsMQX Software Solutions
- Model-Based Design Toolbox (MBDT)Model-Based Design Toolbox (MBDT)
- FreeMASTER
- eIQ Machine Learning Software
- Embedded Software and Tools Clinic
- S32 SDK
- S32 Design Studio
- GUI Guider
- Zephyr Project
- Voice Technology
- Application Software Packs
- Secure Provisioning SDK (SPSDK)
- Processor Expert Software
- Generative AI & LLMs
-
- Topics
- Mobile Robotics - Drones and RoversMobile Robotics - Drones and Rovers
- NXP Training ContentNXP Training Content
- University ProgramsUniversity Programs
- Rapid IoT
- NXP Designs
- SafeAssure-Community
- OSS Security & Maintenance
- Using Our Community
-
- Cloud Lab Forums
-
- Knowledge Bases
- ARM Microcontrollers
- i.MX Processors
- Identification and Security
- Model-Based Design Toolbox (MBDT)
- QorIQ Processing Platforms
- S32 Automotive Processing Platform
- Wireless Connectivity
- CodeWarrior
- MCUXpresso Suite of Software and Tools
- MQX Software Solutions
- RFID / NFC
- Advanced Analog
-
- NXP Tech Blogs
- Home
- :
- モデルベース・デザイン・ツールボックス(MBDT)
- :
- モデルベース・デザイン・ツールボックス(MBDT)
- :
- What is the Tick duration while profiling code in PIL ?
What is the Tick duration while profiling code in PIL ?
- RSS フィードを購読する
- トピックを新着としてマーク
- トピックを既読としてマーク
- このトピックを現在のユーザーにフロートします
- ブックマーク
- 購読
- ミュート
- 印刷用ページ
What is the Tick duration while profiling code in PIL ?
- 新着としてマーク
- ブックマーク
- 購読
- ミュート
- RSS フィードを購読する
- ハイライト
- 印刷
- 不適切なコンテンツを報告
Hi, I have 2 questions (S32K1xx MBDT ver. 4.3.0 in R2022a):
1) When 'Profiling Function' block for S32K116/118 returns ticks number: what is the duration of a single tick ? Block documentation says that it returns number of 'bus ticks'. Looking at generated code for S32K144, inside s32k_clock_init.c, it seems like S32K144 uses for bus clock: system clock / 2 (which for 80MHz clock set by default for examples - gives 25ns bus tick duration). Looking at generated code for S32K116, inside s32k_clock_init.c, it seems like S32K116 uses for it's bus clock: system clock / 1 (which for 40MHz clock set by default for examples - also gives 25ns bus tick duration). Is it true that the duration of the Profiling Function tick is 25ns for S32K11x and S32K14x ? If not - how to find out the correct value ?
2) When using built-in profiling functionality of Simulink (by checking 'Measure task execution time') we get different values than from 'Profiling Function' block (from MBDT). For example:
- using Profiling function block in the referenced PIL model (at the top of this referenced model), with Simulink profiling disabled - we get 124-125 'bus ticks'
- using Simulink profiling, with Profiling function block removed - we get in Simulink report 172 'Ticks' for the function generated from this referenced PIL model
Why these values are different ? How to check duration of the Simulink built-in profiler 'Ticks' ?
Thanks
Maciek
- 新着としてマーク
- ブックマーク
- 購読
- ミュート
- RSS フィードを購読する
- ハイライト
- 印刷
- 不適切なコンテンツを報告
Hello, @Maciek
1) For both profiling methods(using Profiler block and Simulink profiler) the LPIT0 timer is used. Looking inside s32k_clock_config.c file where all clocks are configured, I have noticed the following:
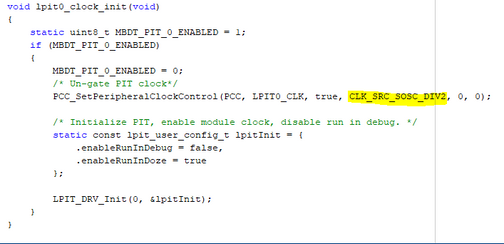
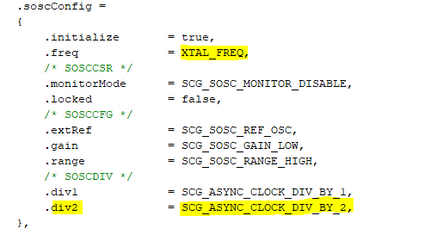
- for S32K11x: the source clock for LPIT0 timer is SOSCDIV2 clock that derives from DIV2 that is set to 2. SOSC_CLK is configured to use the XTAL frequency. In all our examples, XTAL frequency is 40MHz. So in this case, 1 tick duration is going to be 50 nsec (SOSC_CLK/2 = 20 MHz).
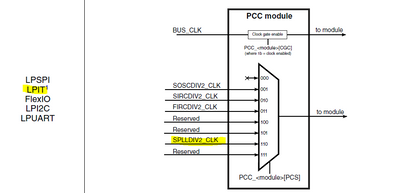
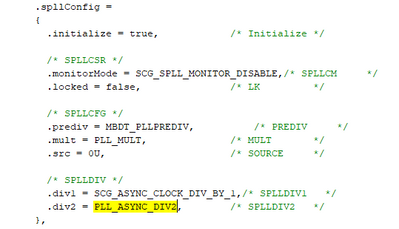
- for S32K14x: the source for LPIT0 timer is set to SPLLDIV2 clock, which is derived from SPLL clock (80 MHz). DIV2 field from the SPLL configuration structure is set to PLL_ASYNC_DIV2 = 4. So, 1 tick duration is also 50 nsec (SPLLDIV2 = SPLL_CLK/4 = 20 MHz), in the case of Core clock frequency of 80 MHz.
2) PIL Profiling report displays average values computed based on some numbers of function calls. Each function call is measured using the LPIT0 timer. This timer is used also when using profiling blocks. When using the profiler block, you will also notice some different ticks values by each function call.
I am not sure how did you obtain that 124-125 ticks from Profiling Block? Is that an average value that you have computed to compare with the average value returned by the Simulink profiler report (in your case 172 ticks)? Could you post some images with your Simulink report?
Regards,
Stefan
- 新着としてマーク
- ブックマーク
- 購読
- ミュート
- RSS フィードを購読する
- ハイライト
- 印刷
- 不適切なコンテンツを報告
Hi @stefancinipeanu,
in the attachment there is a test model and screenshot of my results. The model was tested on S32K116EVB-Q048. As You can see the MBDT profiler block shows 124-125 Ticks (which is 6.20-6.25us). But Simulink profiler report shows 172 Ticks (which is 8.6us).
Can You replicate these results ? Why the difference - if the clock source for both profilers is the same ?
Additionally: the 'Measure task stack usage' option in Simulink profiler doesn't seem to work - after checking it in referenced model, PIL executes but there is no stackProfile variable with stack results anywhere...
It would be very useful to have this option! How to use this option (if it was implemented) ?
Thanks
Maciek
- 新着としてマーク
- ブックマーク
- 購読
- ミュート
- RSS フィードを購読する
- ハイライト
- 印刷
- 不適切なコンテンツを報告
Hi, @Maciek
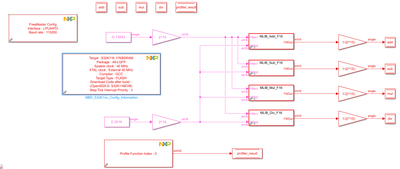
I apologize for my late response. I have investigated your model and I am not quite sure how did you obtain those results displayed on the scope from the profiler block. What I have done is to create a new model and use FreeMASTER to check out the results that profiler block has returned, like in the image below:
Comparing the results between profiler block and PIL profiler functionality, you are right. There are different values because PIL profiler introduces a lot of overhead and I had already open a ticket trying to resolve it. For the moment, I suggest to use profiler blocks because they are more accurate and also I might suggest to modify the compiler flag for optimization from -O1 to -O0 for better accuracy when measuring the time execution of a portion of code.
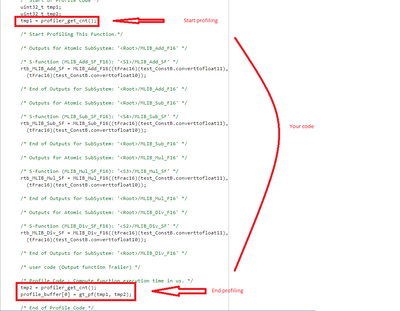
When using the profiler block, the generated code for your subsystem/model will be put inside the function calls that will get tick values from LPIT timer.
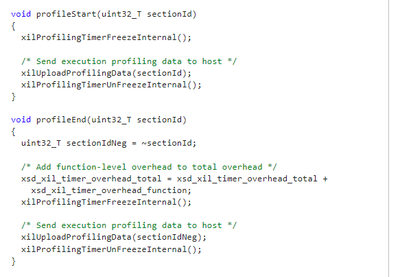
But when using PIL profiling functionality, there are a lot of calls until it gets to use the LPIT timer to get the ticks, because the code for PIL is generated differently than an usual model building. For example, below you can see the functions used to profile the code in PIL for your model that you`ve sent me and those profilerStart and profilerEnd functions will call another functions in cascade to actually measure something and then uploading the results in Simulink. So we can observe the introduced overhead from this cascading function calls.
Hope this helps! If you have questions, feel free to discuss.
Best regards,
Stefan.
- 新着としてマーク
- ブックマーク
- 購読
- ミュート
- RSS フィードを購読する
- ハイライト
- 印刷
- 不適切なコンテンツを報告
Hi @stefancinipeanu,
thanks for the correction of the Tick durations.
I will try to prepare a test model for You that will show the timing difference betweet these two methods.
Is the 'Measure task stack usage' option (profiling option in Simulink -> Verification) implemented/supported in PIL (MBDT for S32K1xx latest version) ?
(as I remember we got some error telling us that some fuctions for this functionality are not implemented...)
Please look also at my earlier post about changing linker file in S32K118 and the serial port bootloader workflow (were to find info about hardware configuration). The BAM example documentation mentions different bootloader image (then the one available in the MBDT installation) and the one available - suggests UART1 is configured for bootloader (not UART0 - as in the example) ?
Thanks for help
Maciek
