
- Forums
- Product Forums
- General Purpose MicrocontrollersGeneral Purpose Microcontrollers
- i.MX Forumsi.MX Forums
- QorIQ Processing PlatformsQorIQ Processing Platforms
- Identification and SecurityIdentification and Security
- Power ManagementPower Management
- Wireless ConnectivityWireless Connectivity
- RFID / NFCRFID / NFC
- Advanced AnalogAdvanced Analog
- Neural Processing UnitsNeural Processing Units
- MCX Microcontrollers
- S32G
- S32K
- S32V
- MPC5xxx
- Other NXP Products
- S12 / MagniV Microcontrollers
- Powertrain and Electrification Analog Drivers
- Sensors
- Vybrid Processors
- Digital Signal Controllers
- 8-bit Microcontrollers
- ColdFire/68K Microcontrollers and Processors
- PowerQUICC Processors
- OSBDM and TBDML
- S32M
- S32Z/E
-
- Solution Forums
- Software Forums
- MCUXpresso Software and ToolsMCUXpresso Software and Tools
- CodeWarriorCodeWarrior
- MQX Software SolutionsMQX Software Solutions
- Model-Based Design Toolbox (MBDT)Model-Based Design Toolbox (MBDT)
- FreeMASTER
- eIQ Machine Learning Software
- Embedded Software and Tools Clinic
- S32 SDK
- S32 Design Studio
- GUI Guider
- Zephyr Project
- Voice Technology
- Application Software Packs
- Secure Provisioning SDK (SPSDK)
- Processor Expert Software
- Generative AI & LLMs
-
- Topics
- Mobile Robotics - Drones and RoversMobile Robotics - Drones and Rovers
- NXP Training ContentNXP Training Content
- University ProgramsUniversity Programs
- Rapid IoT
- NXP Designs
- SafeAssure-Community
- OSS Security & Maintenance
- Using Our Community
-
- Cloud Lab Forums
-
- Knowledge Bases
- ARM Microcontrollers
- i.MX Processors
- Identification and Security
- Model-Based Design Toolbox (MBDT)
- QorIQ Processing Platforms
- S32 Automotive Processing Platform
- Wireless Connectivity
- CodeWarrior
- MCUXpresso Suite of Software and Tools
- MQX Software Solutions
- RFID / NFC
- Advanced Analog
- Neural Processing Units
-
- NXP Tech Blogs
- Home
- :
- MCUXpresso Software and Tools
- :
- MCUXpresso IDE
- :
- Can't launch debug configuration with absolute path to application
Can't launch debug configuration with absolute path to application
- Subscribe to RSS Feed
- Mark Topic as New
- Mark Topic as Read
- Float this Topic for Current User
- Bookmark
- Subscribe
- Mute
- Printer Friendly Page
Can't launch debug configuration with absolute path to application

- Mark as New
- Bookmark
- Subscribe
- Mute
- Subscribe to RSS Feed
- Permalink
- Report Inappropriate Content
I've posted about this before but it got buried in a bunch of other issues. I've also reloaded MCUX 10.2.0 from scratch since then, with a more vanilla configuration, and it's still giving me trouble.
I've got both a P&E Cyclone and an LPC-Link2 connected. The blue debug button is unreliable - it's usually either disabled, doesn't find anything, or if it does, it'll keep creating new debug configurations in my project. I prefer to set up my connections manually to avoid that. That doesn't always work, either.
If I select the application location from the browse button, I'm not able to click 'debug':
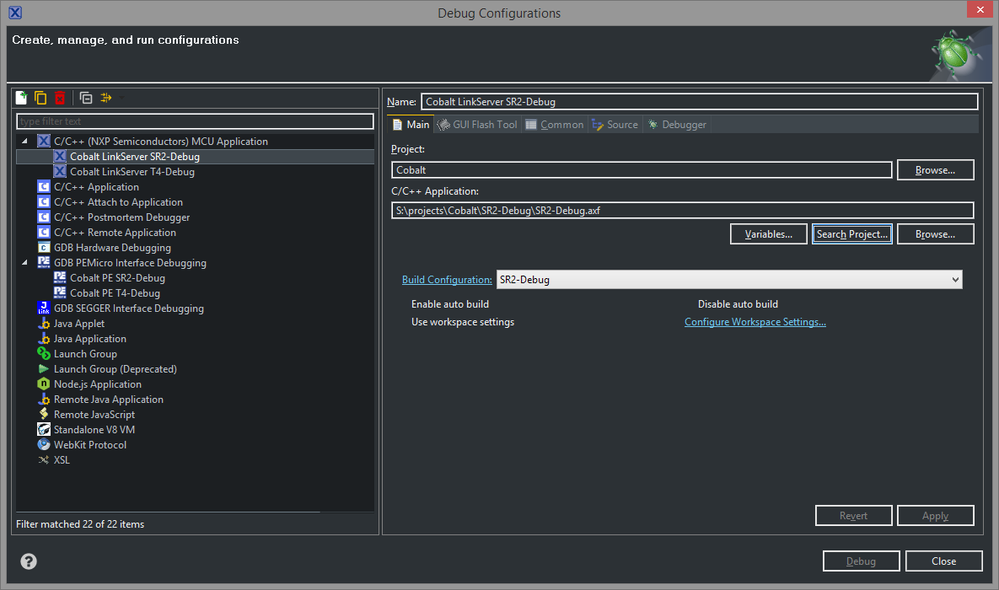
Note that it *doesn't* have the warning at the top about the application not being found, like it would if the file wasn't there. If I click 'search project' instead, it finds it:
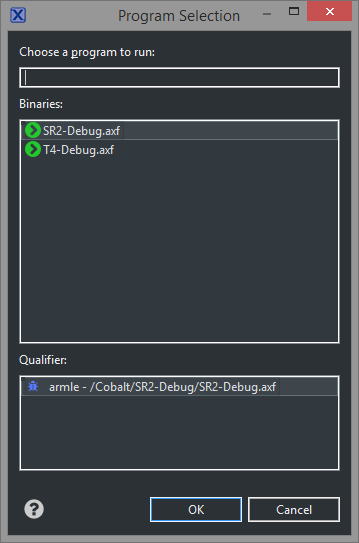
But still the debug button is disabled:
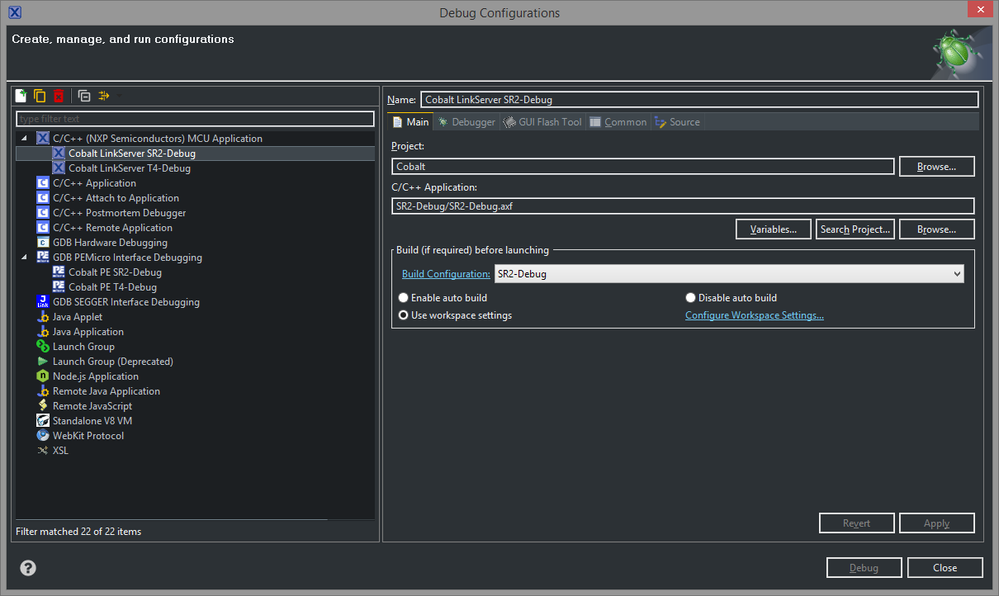
If I click on *another* debug configuration and go back, without changing anything, now the debug button is active:
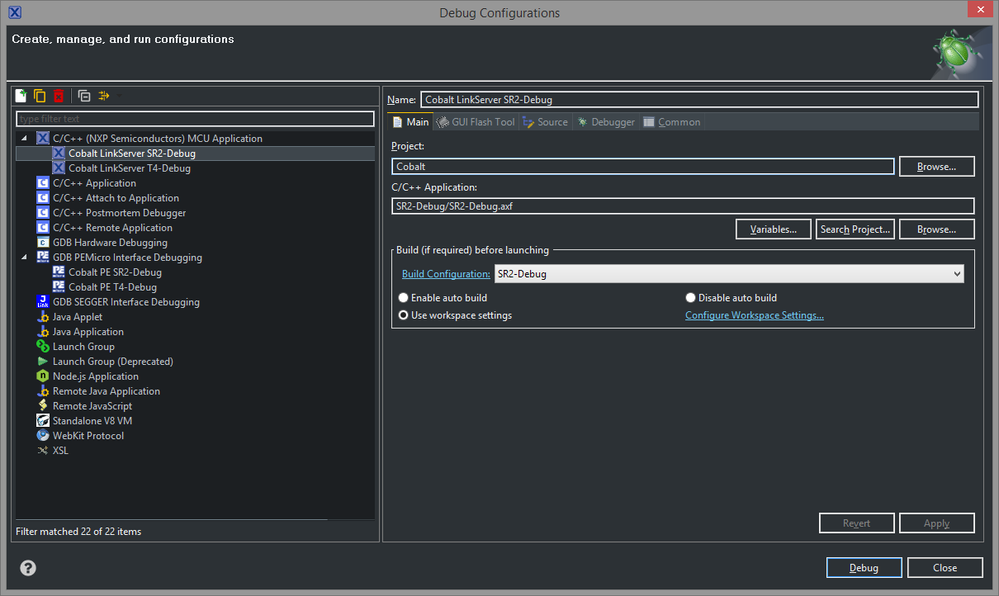
This only works if the location was selected from the search list - if you used browse, switching back and forth doesn't change anything. HOWEVER, if you exit the debug configurations screen and select the configuration from the drop-down of recently used configurations (under the green bug icon) it launches fine. The problem, of course, is getting it into the recently used list when you can't launch it the first time.
At times the 'search project' button hasn't been able to find all of the executables for a project, with the result being that it's impossible to launch a debug configuration unless you manage to get the probe discovery to work from the blue debug button and have it create a configuration. I can't replicate that part right now, but the behavior with the disabled debug button when you've browsed to an executable is consistent.
I've got a workaround for now, but this gets really frustrating when all I want to do is launch the application and the GUI won't let me click the button.
Scott
- Mark as New
- Bookmark
- Subscribe
- Mute
- Subscribe to RSS Feed
- Permalink
- Report Inappropriate Content
I made one useful discovery this morning: it's not enough to have the .axf file present, you have to also refresh the project explorer. I switched from one project to another and found that none of my debug configurations would let me launch, with no executables found in the project despite having just rebuilt it. I captured a video demonstrating the issue:
Dropbox - 2018-07-23 11-07-16.mp4
Now at least I have a workaround for one part of the problem.
Scott
- Mark as New
- Bookmark
- Subscribe
- Mute
- Subscribe to RSS Feed
- Permalink
- Report Inappropriate Content
Bumping this because it's still an issue that annoys me every day. Any time the project is rebuilt, I can't launch the debug session from the debug configuration screen until I've gone to the output folder and pressed 'refresh'.
Do I need to open a ticket for this? I'd really like to see it fixed in a future version.
Thanks,
Scott

- Mark as New
- Bookmark
- Subscribe
- Mute
- Subscribe to RSS Feed
- Permalink
- Report Inappropriate Content
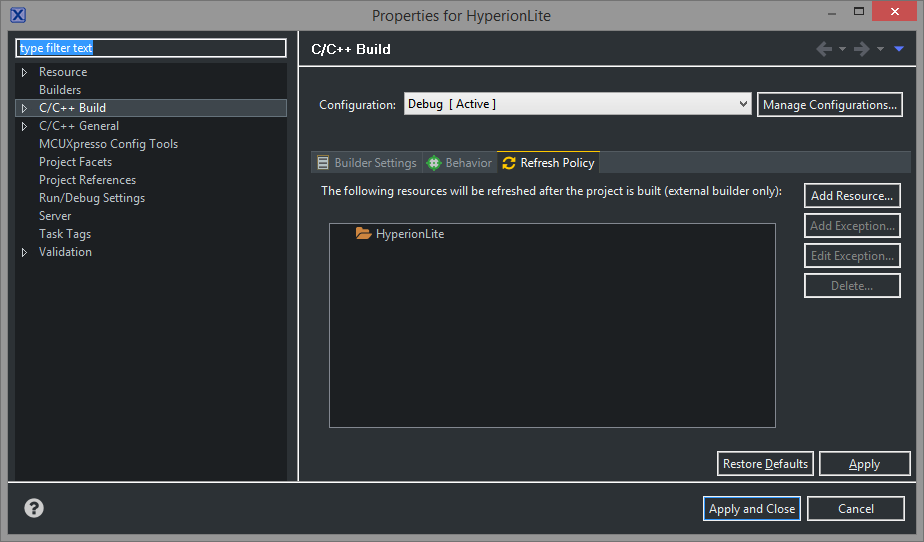
What is your projects "Refresh Policy"? (Project settings->C/C++ Build0>Refresh Policy)
- Mark as New
- Bookmark
- Subscribe
- Mute
- Subscribe to RSS Feed
- Permalink
- Report Inappropriate Content
It just shows a single folder with the name of the project:
- Mark as New
- Bookmark
- Subscribe
- Mute
- Subscribe to RSS Feed
- Permalink
- Report Inappropriate Content
And is the output folder part of the project (i.e. is physically 'underneath' the project folder)?
You could try adding the output folder explicitly to the refresh policy.
- Mark as New
- Bookmark
- Subscribe
- Mute
- Subscribe to RSS Feed
- Permalink
- Report Inappropriate Content
The output folder is under the project folder, yes. And if I try to add a resource, it only lets me select projects, not folders.

 lpcxpresso_supp
- Mark as New
- Bookmark
- Subscribe
- Mute
- Subscribe to RSS Feed
- Permalink
- Report Inappropriate Content
Hi SCOTT,
Let me pick up this initial point:
I've got both a P&E Cyclone and an LPC-Link2 connected. The blue debug button is unreliable - it's usually either disabled, doesn't find anything, or if it does, it'll keep creating new debug configurations in my project. I prefer to set up my connections manually to avoid that. That doesn't always work, either.
The blue debug button in the toolbar reflects the Debug button within the QuickStart Panel. This will be disabled if no project is selected within the Project Explorer view. When a project is selected within the Project Explorer, you will see its name displayed at the top of the QuickStart view and both this button and the Debug button within the QuickStart view will be enabled.
When a debug operation is performed for a given debug probe (by selecting a project and clicking debug from the QuickStart panel), launch configurations for each project build configuration will be created (if they do not already exist). The names of these launch configurations is formed as below e.g.: projectname+debugsolution+buildconfiguration.launch
These behaviours are fundamental to the intended operation of MCUXpresso IDE - if you can demonstrate that they do not occur, please send a reproducer if possible.
Yours,
MCUXpresso IDE Support
- Mark as New
- Bookmark
- Subscribe
- Mute
- Subscribe to RSS Feed
- Permalink
- Report Inappropriate Content
I'm aware that a project has to be selected, and a project file has to have focus - this was actually an annoying issue because the 'welcome' page would come up and of course it's not a project file. I'm not sure if that was changed or if I disabled it.
Sometimes the blue debug button is active, sometimes it's not, and I haven't been able to find any pattern to it. This morning it's there. I never use it because it's so inconsistent, but I decided to give it a try this time.
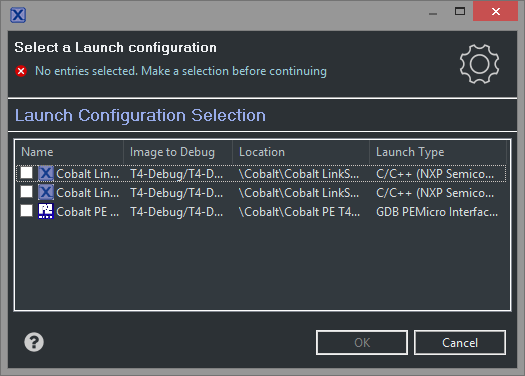
Minor quibble here - the default layout of this dialog is too small to see the names of the debug configurations, even though the project name is a single 6-letter word. I can't tell which of these is my 'attach' configuration without resizing the whole thing.
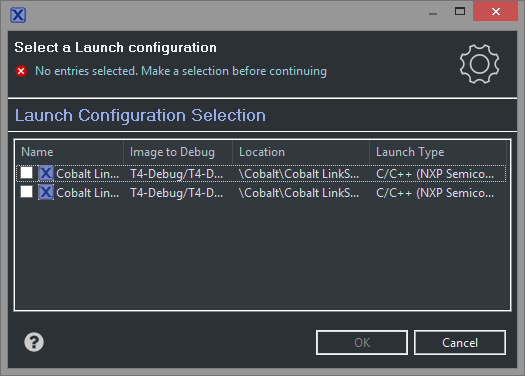
After selecting the launch configuration I want, it asks me to do it a second time, this time with the choices narrowed down to that one probe - but I was selecting a launch configuration, not a probe. And we're back to a layout that can't be read without resizing.
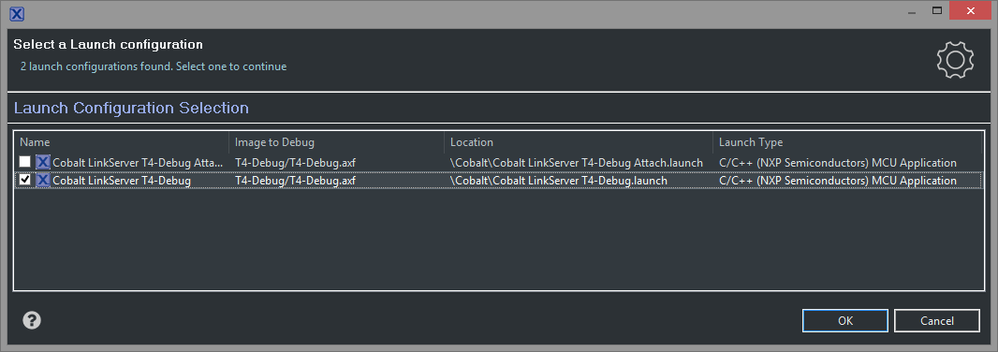
Selected the one I want after resizing.
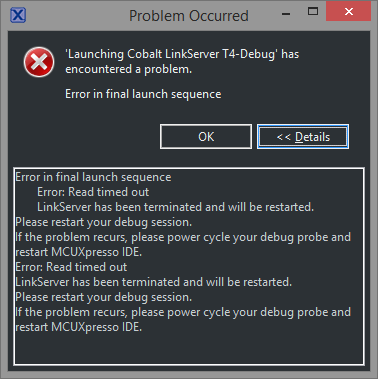
Maybe the LPC-Link2 is having a bad morning. I click on the blue debug button again to give it another try, and this time I get something else:
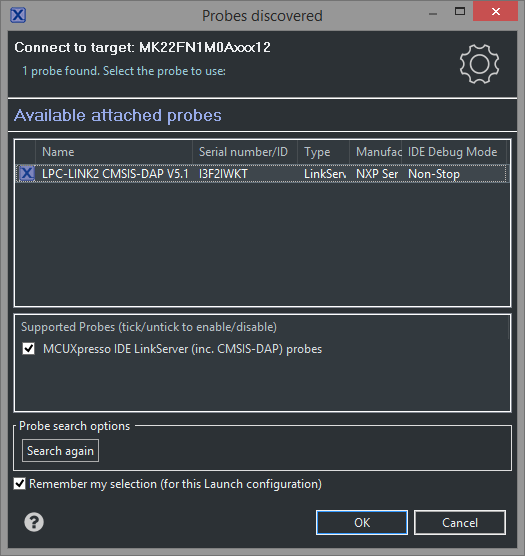
Note that my P&E Cyclone is gone from the list. So I choose the only option, and have to resize the debug configuration dialog again to make my selection. I get the same error again, so I power cycle the probe and the target board and run through the whole thing again, still using the blue debug button, and this time it connects and works properly, but when I go back to the debug configuration screen it's created a new configuration:
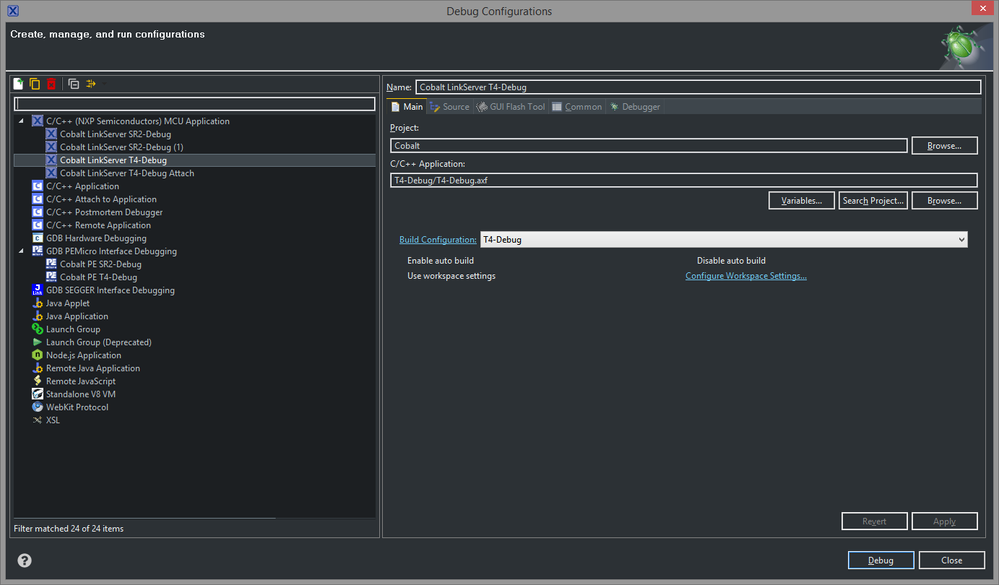
THIS is why I don't use the blue debug button. It's inconsistent, inconvenient, and clutters up the list of configurations. And even after creating that duplicate entry, it still prompts me with two or three dialogs (again, it's not consistent) before letting me launch.
I just restarted MCUX to try again, and now the debug button is disabled. You can see here that the project is indeed selected:
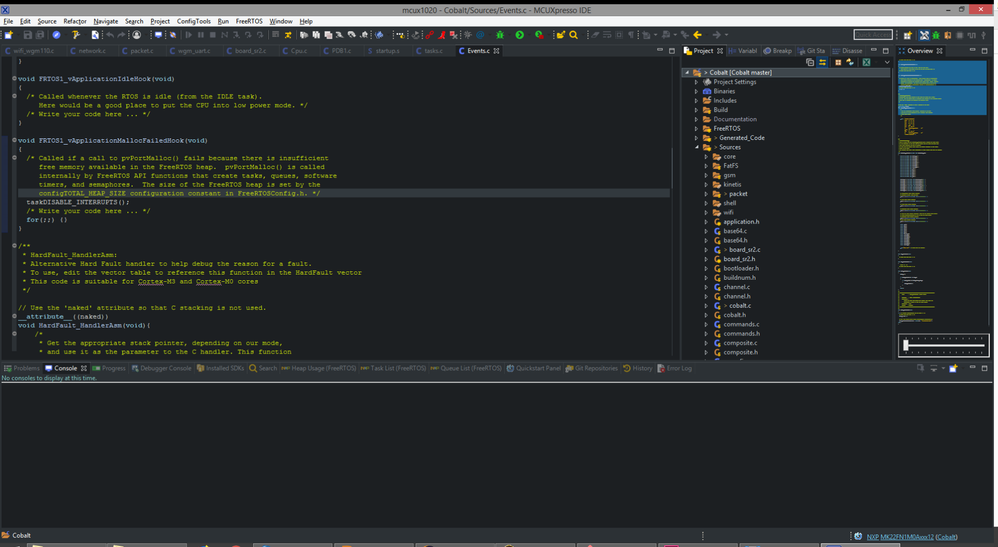
If I click over to the quickstart panel and THEN to a project file, the debug button activates. Maybe the issue is that you've always got the quickstart panel set to come up first and it hasn't been tested with a different layout?
All of this is just to illustrate why I don't use the blue debug button. But the main issue of this post still remains, namely that it won't let you use the debug button from a configuration where the executable has been selected from the browse button.
On top of that, the 'debug' button status doesn't change until you leave the configuration and come back, which makes the experience even more inconsistent. I captured a screen recording - it doesn't show the dialogs that pop up, but it should still illustrate the problem:
Dropbox - 2018-07-23 09-53-29.mp4
Note that in this video, the 'program does not exist' error does NOT appear, as it does when the executable is actually missing:
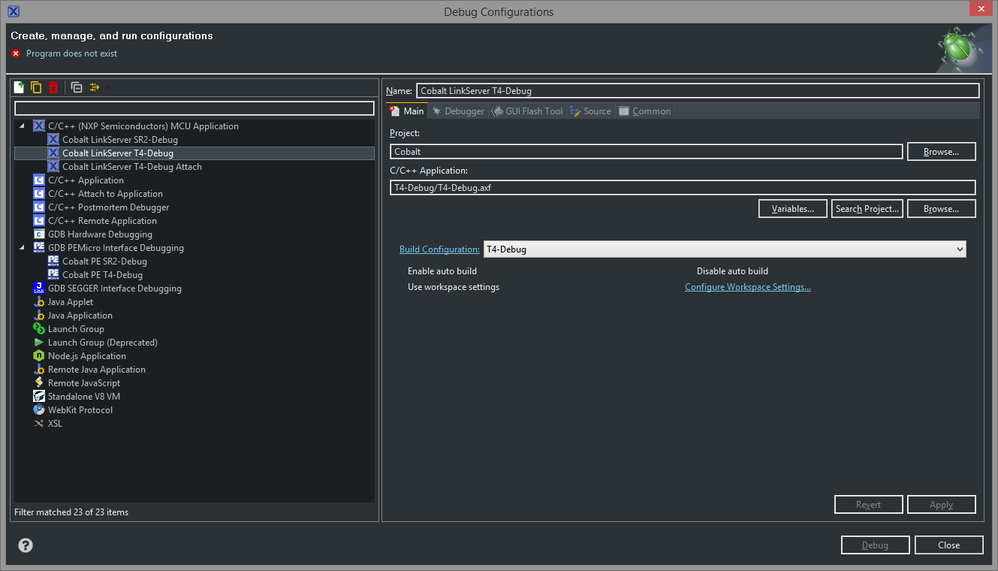
It can also still be launched from the recently used configurations drop-down on the green debug button, so the configuration is in fact valid and whatever enables or disables the 'Debug' button in the configuration screen is incorrect.
 ZhangJennie
- Mark as New
- Bookmark
- Subscribe
- Mute
- Subscribe to RSS Feed
- Permalink
- Report Inappropriate Content
Hi.
Is this problem related with one project or a common issue for all project?
I ever had one customer resolve similar problem by change another workspace. To test if this problem associates with workspace, please create a new workspace, test your project under this new workspace. How it works?
Have a great day,
Jennie Zhang
-----------------------------------------------------------------------------------------------------------------------
Note: If this post answers your question, please click the Correct Answer button. Thank you!
-----------------------------------------------------------------------------------------------------------------------
