- Forums
- Product Forums
- General Purpose MicrocontrollersGeneral Purpose Microcontrollers
- i.MX Forumsi.MX Forums
- QorIQ Processing PlatformsQorIQ Processing Platforms
- Identification and SecurityIdentification and Security
- Power ManagementPower Management
- Wireless ConnectivityWireless Connectivity
- RFID / NFCRFID / NFC
- Advanced AnalogAdvanced Analog
- MCX Microcontrollers
- S32G
- S32K
- S32V
- MPC5xxx
- Other NXP Products
- S12 / MagniV Microcontrollers
- Powertrain and Electrification Analog Drivers
- Sensors
- Vybrid Processors
- Digital Signal Controllers
- 8-bit Microcontrollers
- ColdFire/68K Microcontrollers and Processors
- PowerQUICC Processors
- OSBDM and TBDML
- S32M
- S32Z/E
-
- Solution Forums
- Software Forums
- MCUXpresso Software and ToolsMCUXpresso Software and Tools
- CodeWarriorCodeWarrior
- MQX Software SolutionsMQX Software Solutions
- Model-Based Design Toolbox (MBDT)Model-Based Design Toolbox (MBDT)
- FreeMASTER
- eIQ Machine Learning Software
- Embedded Software and Tools Clinic
- S32 SDK
- S32 Design Studio
- GUI Guider
- Zephyr Project
- Voice Technology
- Application Software Packs
- Secure Provisioning SDK (SPSDK)
- Processor Expert Software
- Generative AI & LLMs
-
- Topics
- Mobile Robotics - Drones and RoversMobile Robotics - Drones and Rovers
- NXP Training ContentNXP Training Content
- University ProgramsUniversity Programs
- Rapid IoT
- NXP Designs
- SafeAssure-Community
- OSS Security & Maintenance
- Using Our Community
-
- Cloud Lab Forums
-
- Knowledge Bases
- ARM Microcontrollers
- i.MX Processors
- Identification and Security
- Model-Based Design Toolbox (MBDT)
- QorIQ Processing Platforms
- S32 Automotive Processing Platform
- Wireless Connectivity
- CodeWarrior
- MCUXpresso Suite of Software and Tools
- MQX Software Solutions
- RFID / NFC
- Advanced Analog
-
- NXP Tech Blogs
- Home
- :
- MCUXpressoソフトウェアとツール
- :
- Kinetisデザインスタジオ
- :
- How do I resolve 'Can not enter background mode'?
How do I resolve 'Can not enter background mode'?
- RSS フィードを購読する
- トピックを新着としてマーク
- トピックを既読としてマーク
- このトピックを現在のユーザーにフロートします
- ブックマーク
- 購読
- ミュート
- 印刷用ページ
How do I resolve 'Can not enter background mode'?
- 新着としてマーク
- ブックマーク
- 購読
- ミュート
- RSS フィードを購読する
- ハイライト
- 印刷
- 不適切なコンテンツを報告
I have a K20DN512VLQ10 on a custom board and I'm attempting to debug the default Kinetis Design Studio project via a P&E Multilink Universal on Windows 8.1.
When I create a default project for the chip and immediately debug it, the target resets, and this is the output I get in the console:
P&E GDB Server, Version 5.13.02.00
Copyright 2014, P&E Microcomputer Systems Inc, All rights reserved
Loading library C:\Freescale\KDS_2.0.0\eclipse\plugins\com.pemicro.debug.gdbjtag.pne_1.1.7.201410171532\win32\gdi\unit_ngs_arm_internal.dll ... Done.
Command line arguments: -device=K20DN512 -startserver -singlesession -serverport=7224 -interface=USBMULTILINK -speed=5000 -usejtag -port=USB1 -USE_CYCLONEPRO_RELAYS=0 -FORCE_MASS_ERASE=0
Device selected is k20dn512
User Specified Hardware Selection : Interface=USBMULTILINK and Port=USB1
Connecting to target.
P&E Interface detected - Flash Version 6.10
Can not enter background mode .
Unable to initialize PEDebug.
PE-ERROR: Failed to Initialize Target
Server running on 127.0.0.1:7224
Connection from "127.0.0.1" via 127.0.0.1
PE-ERROR: Target is not connected
Disconnected from "127.0.0.1" via 127.0.0.1
Target Disconnected.
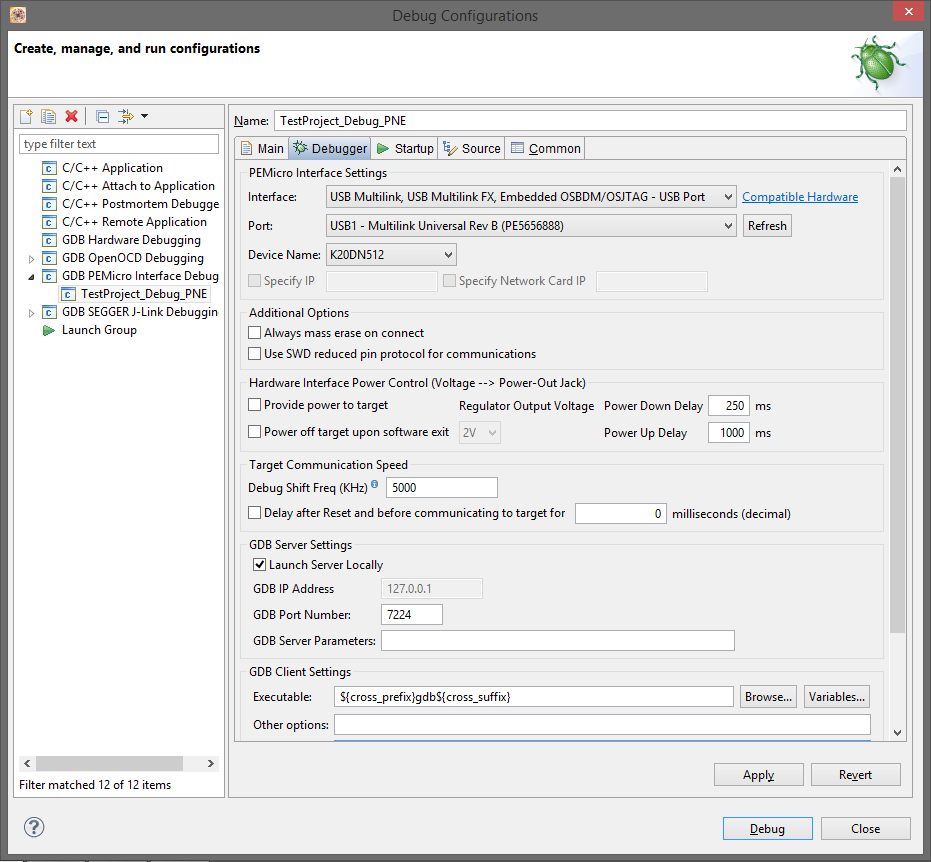
I have made two changes to the debug configuration:
- Unchecked 'Use SWD reduced pin protocol for communications' as the board has a 20-pin JTAG port.
- Changed device name from 'K20DN512M10' to 'K20DN512' as the package identifier for the chip is 'LQ', not 'Mx'.
Trying different combinations of these settings (using SWD, not using SWD, using different K20 device names) has had no effect. Interestingly, after the 'Can not enter background mode' message, two unprintable characters are echoed to the console (both 0x07).
I've searched this forum for solutions without success. Attached is an image of my debug configuration. Is there a specific configuration setting I'm missing?
Thanks.
- 新着としてマーク
- ブックマーク
- 購読
- ミュート
- RSS フィードを購読する
- ハイライト
- 印刷
- 不適切なコンテンツを報告
I hate to ask this, but it is good to check assumptions. Since it is your own target board (correct?), are you confidence your hardware is good?
We recently brought up our own K22F board. I could program the code and start execution, but when we tried to setup the watchdog the system reset. It turned out that while we didn't need Vbat for the RTC just yet, we hadn't installed the Schottky diode array that switched the chips Vbat between the battery and Vcc. When we did, everything worked fine. I could understand accessing the RTC causing a problem, but not so much the Watchdog.
Just goes to show that one of the challenges of embedded is there are lots and lots and lots of things that have to be "just right" or "she no worky".
Best of luck regardless. Getting a new target board up is always a challenge. I am a huge fan of bringing a new system up in stages, but sooner or later you have to cross your fingers, flip the switch, and hope the micro feels like talking to you. :smileywink:
- 新着としてマーク
- ブックマーク
- 購読
- ミュート
- RSS フィードを購読する
- ハイライト
- 印刷
- 不適切なコンテンツを報告
Hi Andrew Perkins,
Take a look to the following post created by our colleague Erich Styger, it mentions a check list and provides some hints that might help you resolve the issue:
Debugging Failure: Check List and Hints | MCU on Eclipse
Please also review the below document where you can find information about the 20-pin header debug interface Implementation (section 2.1.5.3 Debug interface) and make sure your connections are correct:
http://cache.freescale.com/files/32bit/doc/quick_ref_guide/KQRUG.pdf
Hope it helps!
Best Regards,
Carlos Mendoza
Technical Support Engineer
-----------------------------------------------------------------------------------------------------------------------
Note: If this post answers your question, please click the Correct Answer button. Thank you!
-----------------------------------------------------------------------------------------------------------------------
- 新着としてマーク
- ブックマーク
- 購読
- ミュート
- RSS フィードを購読する
- ハイライト
- 印刷
- 不適切なコンテンツを報告
Erich just plain rocks. I have shared the link to his debugging page to LinkedIn, including several groups. It's as good a "how to get debugging working" list as I have ever seen.

