- NXP Forums
- Product Forums
- General Purpose MicrocontrollersGeneral Purpose Microcontrollers
- i.MX Forumsi.MX Forums
- QorIQ Processing PlatformsQorIQ Processing Platforms
- Identification and SecurityIdentification and Security
- Power ManagementPower Management
- MCX Microcontrollers
- S32G
- S32K
- S32V
- MPC5xxx
- Other NXP Products
- Wireless Connectivity
- S12 / MagniV Microcontrollers
- Powertrain and Electrification Analog Drivers
- Sensors
- Vybrid Processors
- Digital Signal Controllers
- 8-bit Microcontrollers
- ColdFire/68K Microcontrollers and Processors
- PowerQUICC Processors
- OSBDM and TBDML
-
- Solution Forums
- Software Forums
- MCUXpresso Software and ToolsMCUXpresso Software and Tools
- CodeWarriorCodeWarrior
- MQX Software SolutionsMQX Software Solutions
- Model-Based Design Toolbox (MBDT)Model-Based Design Toolbox (MBDT)
- FreeMASTER
- eIQ Machine Learning Software
- Embedded Software and Tools Clinic
- S32 SDK
- S32 Design Studio
- GUI Guider
- Zephyr Project
- Voice Technology
- Application Software Packs
- Secure Provisioning SDK (SPSDK)
- Processor Expert Software
-
- Topics
- Mobile Robotics - Drones and RoversMobile Robotics - Drones and Rovers
- NXP Training ContentNXP Training Content
- University ProgramsUniversity Programs
- Rapid IoT
- NXP Designs
- SafeAssure-Community
- OSS Security & Maintenance
- Using Our Community
-
- Cloud Lab Forums
-
- Home
- :
- i.MX Forums
- :
- i.MX RT
- :
- Uploading to and executing from SDRAM on the i.MX RT1050 EVKB
Uploading to and executing from SDRAM on the i.MX RT1050 EVKB
- Subscribe to RSS Feed
- Mark Topic as New
- Mark Topic as Read
- Float this Topic for Current User
- Bookmark
- Subscribe
- Mute
- Printer Friendly Page
- Mark as New
- Bookmark
- Subscribe
- Mute
- Subscribe to RSS Feed
- Permalink
- Report Inappropriate Content
Hello,
I'm creating an instruction manual for the i.MX RT 1050 EVK for hobbyists. It is a work in progress and can be downloaded from Dropbox here
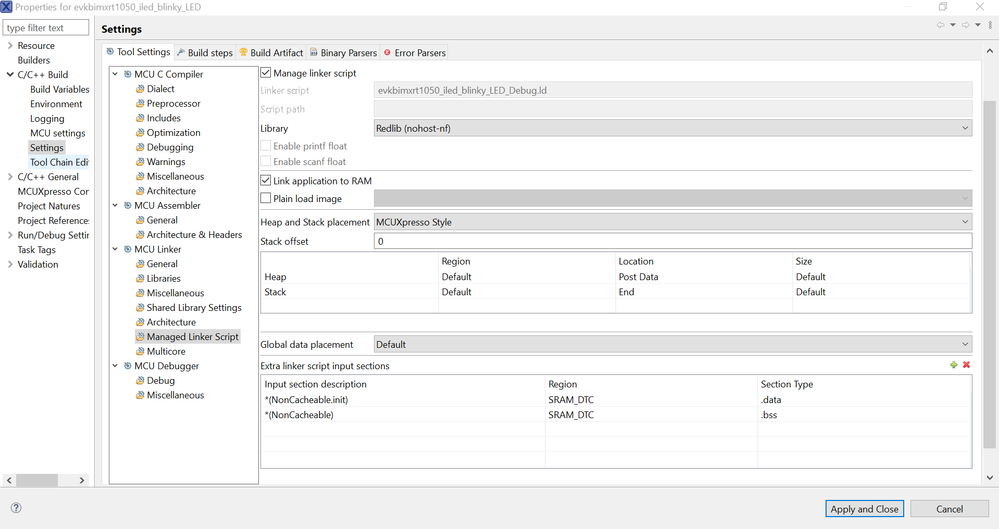
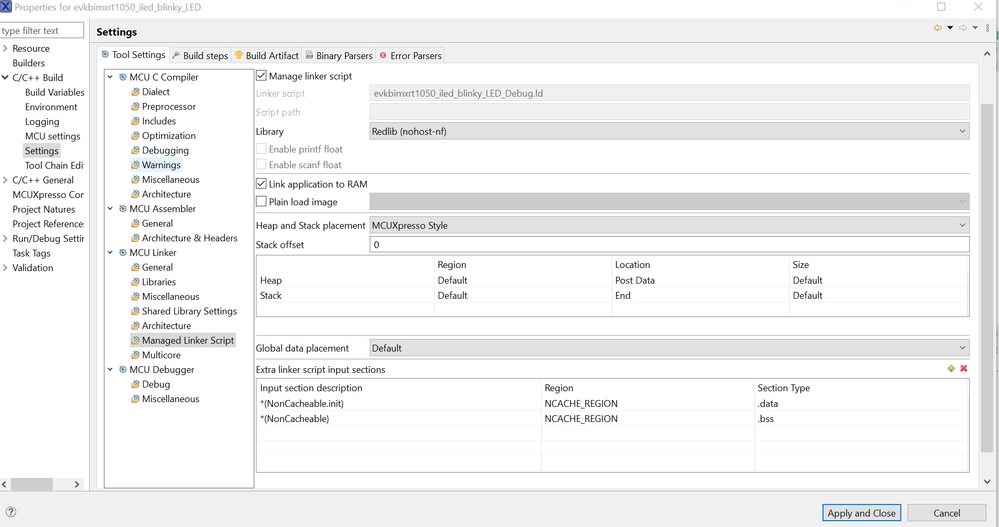
In the manual I show how to execute from SRAM. It is very straightforward - simply check the "Link application to RAM" box:
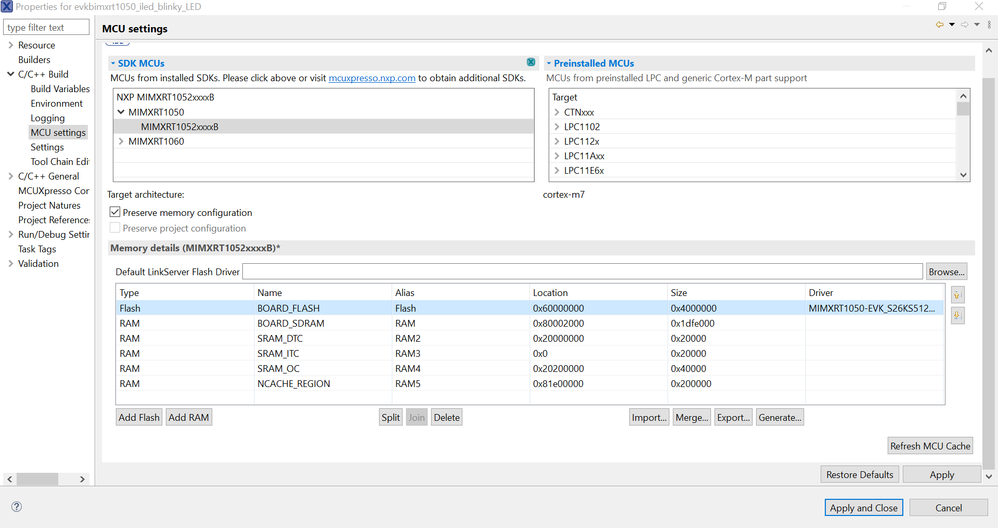
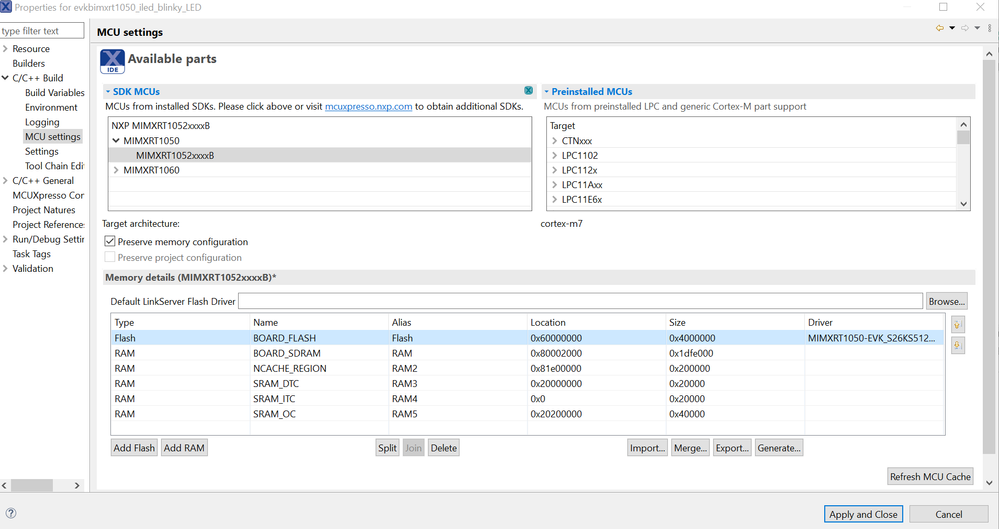
This places code in "SRAM_DTC", as this memory is in the first row of the table in the "MCU settings" window. I am able to upload and debug without any problems.
Now I'm trying to upload to and execute from SDRAM. This is more complicated, and some of the suggestions I've tried without success include:
1) Move "BOARD_SDRAM" to the second row of the table
2) Change the location and size of the "BOARD_SDRAM" memory
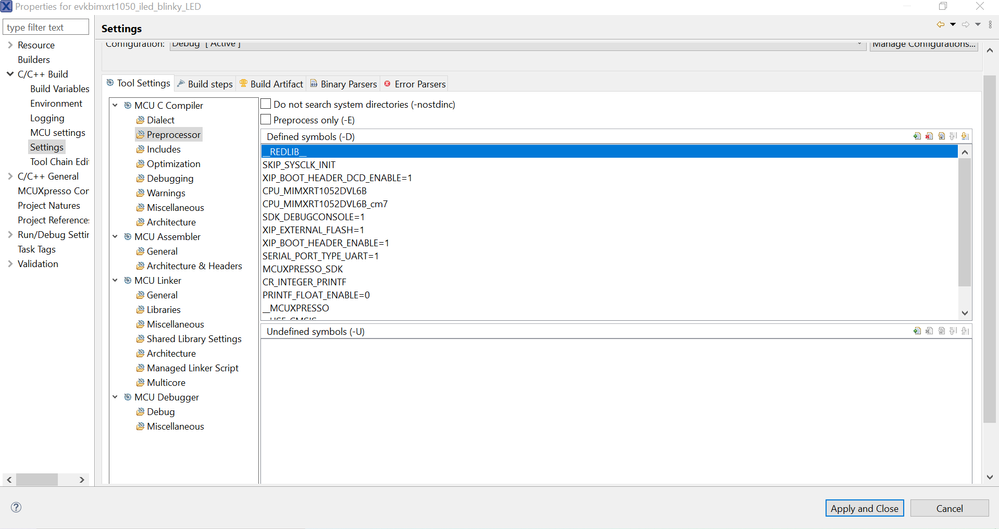
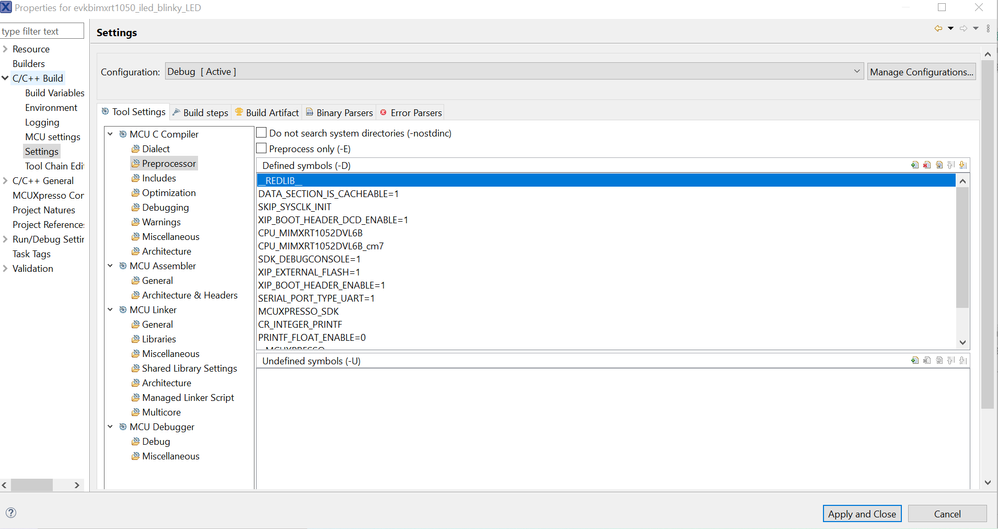
3) Modify the Preprocessor
Below are my settings and the error message generated when I try to start a debug session:
The Console View contains the following message:
MCUXpresso IDE RedlinkMulti Driver v11.5 (Dec 16 2021 12:38:31 - crt_emu_cm_redlink build 2)
Found chip XML file in C:/Daniel/monic/i.MX RT1050/Blinking an LED/evkbimxrt1050_iled_blinky_LED/Debug\MIMXRT1052xxxxB.xml
( 5) Remote configuration complete
Reconnected to existing LinkServer process.
============= SCRIPT: RT1050_connect.scp =============
RT1050 Connect Script
DpID = 0BD11477
APID = 0x04770041
Disabling MPU
Configure FlexRAM for 256KB OC RAM, 128KB I-TCM, 128KB D-TCM
Finished
============= END SCRIPT =============================
Probe Firmware: CMSIS-DAP (ARM)
Serial Number: 0227000047784e4500259004d7450022ddb1000097969900
VID:PID: 0D28:0204
USB Path: \\?\hid#vid_0d28&pid_0204&mi_03#8&2d82ebeb&0&0000#{4d1e55b2-f16f-11cf-88cb-001111000030}
Using memory from core 0 after searching for a good core
debug interface type = CoreSight DP (DAP DP ID 0BD11477) over SWD TAP 0
processor type = Cortex-M7 (CPU ID 00000C27) on DAP AP 0
number of h/w breakpoints = 8
number of flash patches = 0
number of h/w watchpoints = 4
Probe(0): Connected&Reset. DpID: 0BD11477. CpuID: 00000C27. Info: <None>
Debug protocol: SWD. RTCK: Disabled. Vector catch: Disabled.
Content of CoreSight Debug ROM(s):
RBASE E00FD000: CID B105100D PID 000008E88C ROM (type 0x1)
ROM 1 E00FE000: CID B105100D PID 04000BB4C8 ROM (type 0x1)
ROM 2 E00FF000: CID B105100D PID 04000BB4C7 ROM (type 0x1)
ROM 3 E000E000: CID B105E00D PID 04000BB00C Gen SCS (type 0x0)
ROM 3 E0001000: CID B105E00D PID 04000BB002 Gen DWT (type 0x0)
ROM 3 E0002000: CID B105E00D PID 04000BB00E Gen (type 0x0)
ROM 3 E0000000: CID B105E00D PID 04000BB001 Gen ITM (type 0x0)
ROM 2 E0041000: CID B105900D PID 04001BB975 CSt ARM ETMv4.0 type 0x13 Trace Source - Core
ROM 2 E0042000: CID B105900D PID 04004BB906 CSt type 0x14 Debug Control - Trigger, e.g. ECT
ROM 1 E0040000: CID B105900D PID 04000BB9A9 CSt type 0x11 Trace Sink - TPIU
ROM 1 E0043000: CID B105F00D PID 04001BB101 Sys (type 0x0)
NXP: MIMXRT1052xxxxB
DAP stride is 1024 bytes (256 words)
Connected: was_reset=false. was_stopped=true
Awaiting telnet connection to port 3330 ...
GDB nonstop mode enabled
GDB stub (C:\nxp\MCUXpressoIDE_11.5.0_7232\ide\plugins\com.nxp.mcuxpresso.tools.bin.win32_11.5.0.202112161150\binaries\crt_emu_cm_redlink) terminating - GDB protocol problem: Pipe has been closed by GDB.
Solved! Go to Solution.
- Mark as New
- Bookmark
- Subscribe
- Mute
- Subscribe to RSS Feed
- Permalink
- Report Inappropriate Content
Hi @danielmilutinov ,
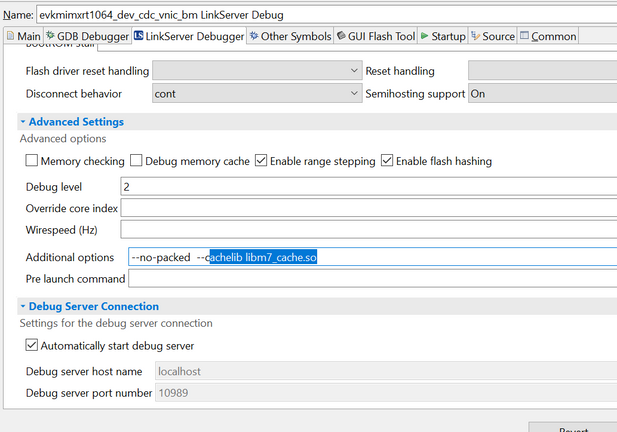
Yes, this is due to the cache issue. Before debug in SDRAM, you should add --cachelib libm7_cache.so to Additional options.
Regards,
Jing
- Mark as New
- Bookmark
- Subscribe
- Mute
- Subscribe to RSS Feed
- Permalink
- Report Inappropriate Content
I can now upload to and execute from SDRAM. However breakpoints don't work during a debug session - any breakpoints that I set are ignored and the program runs as if there are no breakpoints.
I was able to upload to and execute from SDRAM by making the following changes:
1) Move "NCACHE_REGION" up in the table:
2) Add "DATA_SECTION_IS_CACHEABLE=1" to the Preprocessor:
3) Change "SRAM_DTC" to "NCACHE_REGION" in "Managed Linker Script":
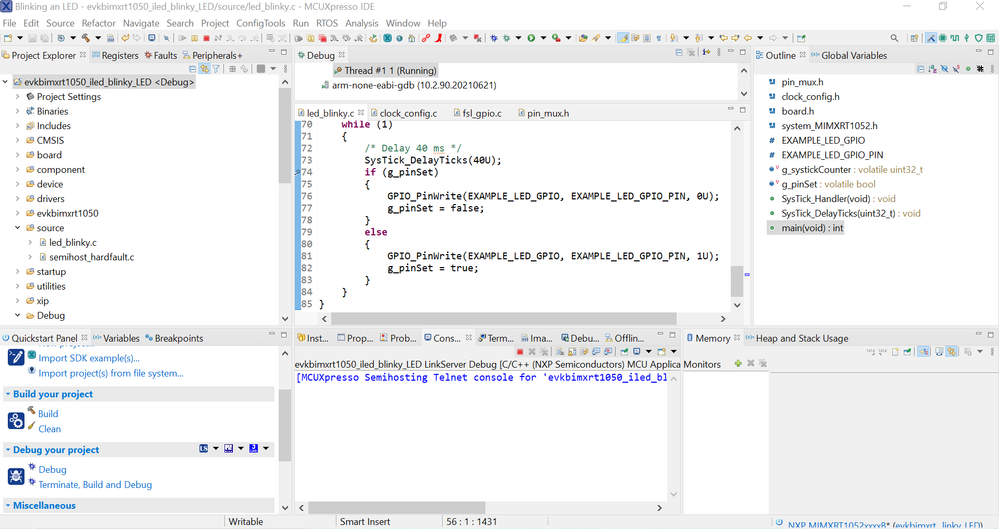
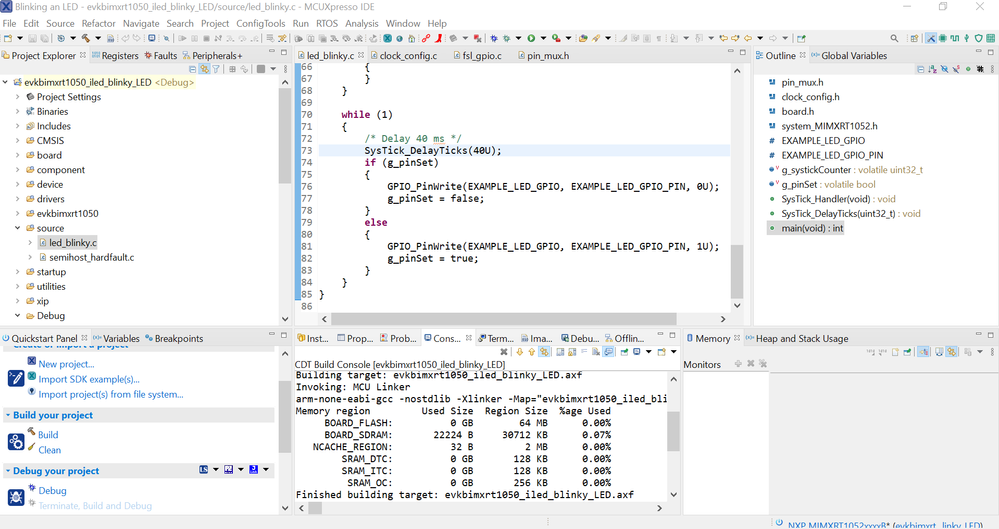
As mentioned, I can now upload to and execute from SDRAM the "iled_blinky" example from "demo_apps", but any breakpoints set during a debug session have no effect:
- Mark as New
- Bookmark
- Subscribe
- Mute
- Subscribe to RSS Feed
- Permalink
- Report Inappropriate Content
Hi @danielmilutinov ,
Yes, this is due to the cache issue. Before debug in SDRAM, you should add --cachelib libm7_cache.so to Additional options.
Regards,
Jing
- Mark as New
- Bookmark
- Subscribe
- Mute
- Subscribe to RSS Feed
- Permalink
- Report Inappropriate Content
Thank you Jing, that works nicely. After adding "--cachelib libm7_cache.so" in the "Additional options" field I debug by pressing the green bug icon in the toolbar and everything works well (debugging by pressing "Debug" in the "Quickstart Panel" View did not work for me).
I'll add step-by-step instructions to my i.MX RT1050 EVK manual for hobbyists and upload it to Dropbox.
