Interrupt Handlers Hang until Another Interrupt Handler Returns
- 新着としてマーク
- ブックマーク
- 購読
- ミュート
- RSS フィードを購読する
- ハイライト
- 印刷
- 不適切なコンテンツを報告
Good day @ErichStyger and NXP community
Now that NXP has fixed the MCUXpresso IDE's RT1170 SWO tracing problem (as described in my previous post), I can finally use it to debug my problem.
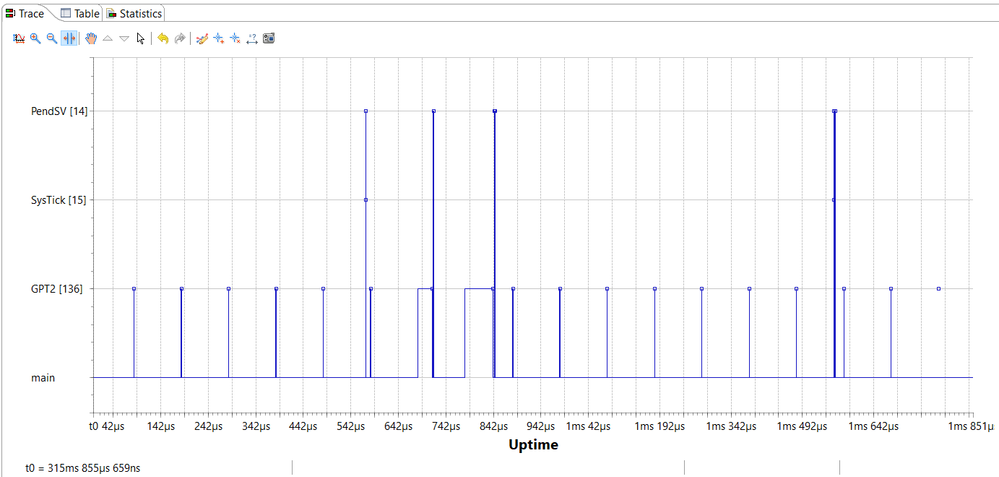
I am running FreeRTOS on NXP's RT1170 processor. When I take a trace, I see that some of the interrupt handlers are active for very long - in the range of 50 - 60us. There are no obvious reasons that any of these interrupt handlers should take this long to execute (no while loops, etc.). Some of the interrupt handlers are unchanged from FreeRTOS and NXP (PendSV and SysTick).
My current theory, after reading a somewhat similar NXP community post (which is unsolved), is that although the interrupt handlers finish executing in quite a short time, they do not return properly. By this, I mean that the program counter is not changed to the task range. The processor seems to remain in the 'interrupt context', until the next interrupt handler executes and returns the processor to the 'task context'.
A trace of my system can be seen below.
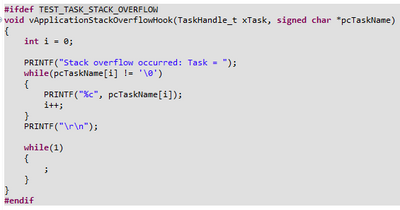
I thought that FreeRTOS's RunTimeStats, or my vApplicationStackOverflowHook() could be responsible for these delays. For these reasons, I disabled/removed both of these features before taking the above trace.
I would greatly appreciate some input from someone who has solved this before.
@ErichStyger, I read your guide on SWO tracing, so I was wondering if you had come across something like this in the past?
- 新着としてマーク
- ブックマーク
- 購読
- ミュート
- RSS フィードを購読する
- ハイライト
- 印刷
- 不適切なコンテンツを報告
I don't have any i.MX RT1070 (only 1060), so not sure if this is a hardware problem or not. But I have not seen such a thing on my side.
configGENERATE_RUNTIME_STATS will not help/affect your case here: all what it does is tracking the time spent of FreeRTOS tasks, and is not affecting itself interrupt behavior.
What for sure could affect the time returning from an ISR is the hardware restoring the previous context. That can take more time because of the access time to FLASH and RAM?
What certainly would help is a full instruction trace (see https://mcuoneclipse.com/2016/10/09/first-steps-with-ozone-and-the-segger-j-link-trace-pro/). Other than that, I would instrument your ISR in question with a GPIO pin set at the beginning and one at the end, just to if it really spends time in that ISR or outside?
I hope this helps,
Erich
- 新着としてマーク
- ブックマーク
- 購読
- ミュート
- RSS フィードを購読する
- ハイライト
- 印刷
- 不適切なコンテンツを報告
Hi @ErichStyger
Thanks for your reply.
We have been looking into our problem in more detail.
I'm not too sure about the FLASH and RAM delaying the interrupts - why would this only happen intermittently then?
Unfortunately I don't have the hardware to do a full instruction-trace, and that equipment is pretty expensive!
We have done the GPIO pin toggle like you suggested. This confirmed that the processor is indeed in the interrupt for this long.
To ease debugging, we simplified our system by disabling many of the interrupts.
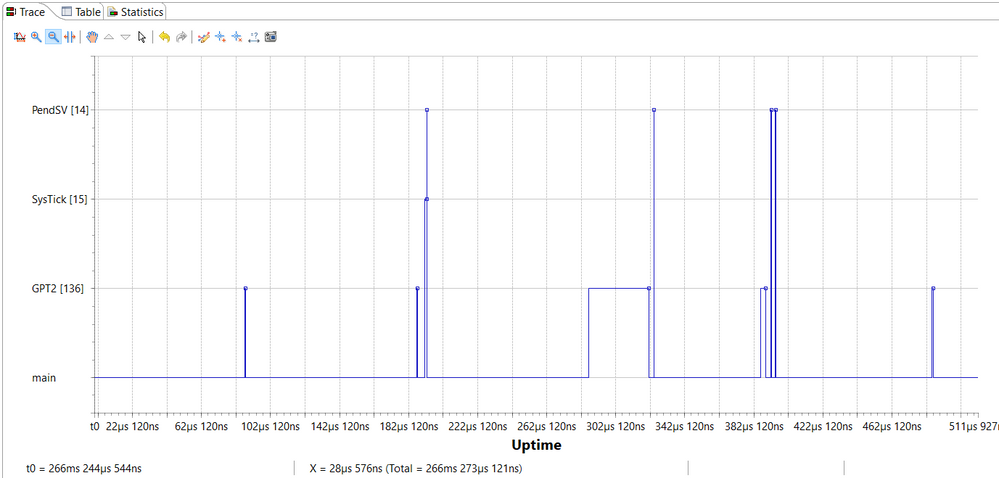
Here are two traces that show the problem more clearly:
It is clear that GPT2's IRQ handler is active for abnormally long. We have confirmed this with GPIO pin toggling and an oscilloscope. These 'delayed' interrupt handlers seem to precede a PendSV IRQ handler.
We believe the problem could be linked to when the PendSV handler is called multiple times, in close succession. In the first trace, one can see that the 'delay' of the GPT2 IRQ handler worsens each time the PendSV IRQ handler is called.
We would greatly appreciate any help/advice.
Kind regards
D_TTSA
- 新着としてマーク
- ブックマーク
- 購読
- ミュート
- RSS フィードを購読する
- ハイライト
- 印刷
- 不適切なコンテンツを報告
It might be related to the interrupt urgency assigned to the PendSV interrupt.
On a side-note, about SWO IRQ tracing on i.MX RT: you might check out the latest MCUXpresso IDE 11.6.1, as the release note indicates a fix in that area.
- 新着としてマーク
- ブックマーク
- 購読
- ミュート
- RSS フィードを購読する
- ハイライト
- 印刷
- 不適切なコンテンツを報告
Hi @ErichStyger
Thanks for your response.
The PendSV interrupt's priority is set to the default priority - 0x0F (lowest priority in my system). The SysTick interrupt has the same priority. According to what I've read on the FreeRTOS forum, it should be this way.
Thanks for mentioning the SWO tracing fix. I know about it, because I told NXP about it in one of my previous posts.
At the moment, our theory is that the problem is related to ARM's interrupt nesting. If that's the case, it is a lot more complex to solve than I had hoped.
Please let me know if you have any further advice.
Kind regards
D_TTSA
- 新着としてマーク
- ブックマーク
- 購読
- ミュート
- RSS フィードを購読する
- ハイライト
- 印刷
- 不適切なコンテンツを報告
Hi @ErichStyger
Thank you for your replies.
I looked into suggestions, but we stumbled upon the solution elsewhere.
Problem Explanation
By default, in the RT1176, the program’s code is stored in QSPI (external) FLASH memory. This FLASH has a clock speed of 133MHz. The connection between this FLASH and the processor is only 4 bits wide, so it takes 4 sequential accesses to the FLASH to retrieve one instruction (16 bits). The rate at which we can retrieve instructions from the FLASH is thus 33.25MHz. This is much slower than the (industrial) processor’s 792MHz clock. The processor thus heavily relies on ARM’s ‘performance-enhancing’ instruction ‘speculative accesses’ to reduce the effects of this bottleneck. This feature copies the processor’s ‘predicted’ instructions into its level 1 cache, so that they are immediately available if the processor requires them.
However, these ‘speculative accesses’ are inaccurate when interrupts occur, since the processor cannot predict when interrupts will occur. Therefore, whenever an ISR exits, “__DSB()” and/or “__ISB()” is called, and the processor’s instruction and data pipelines are flushed.
Solution
Code that is stored in the RT117's SRAM_ITC is never copied into cache. Since it is ‘tightly-coupled’ to the processor (and can thus be accessed synchronously, with no delays), there is no benefit if its contents is cached. Consequently, the ARM processor does not apply its ‘performance enhancing’ speculative accessing techniques, or any other ‘optimisations’ on this code. Therefore, there are less/no instructions in the processor’s pipeline when returning from an ISR, so this delay is minimised.
Therefore, this problem is solved by storing as much of the ISR code as possible (preferably all) in the SRAM_ITC memory. This is in line with the recommendation found in the conclusion of NXP’s application note on the ARM Cortex-M7’s L1 cache.


