- NXP Forums
- Product Forums
- General Purpose MicrocontrollersGeneral Purpose Microcontrollers
- i.MX Forumsi.MX Forums
- QorIQ Processing PlatformsQorIQ Processing Platforms
- Identification and SecurityIdentification and Security
- Power ManagementPower Management
- MCX Microcontrollers
- S32G
- S32K
- S32V
- MPC5xxx
- Other NXP Products
- Wireless Connectivity
- S12 / MagniV Microcontrollers
- Powertrain and Electrification Analog Drivers
- Sensors
- Vybrid Processors
- Digital Signal Controllers
- 8-bit Microcontrollers
- ColdFire/68K Microcontrollers and Processors
- PowerQUICC Processors
- OSBDM and TBDML
-
- Solution Forums
- Software Forums
- MCUXpresso Software and ToolsMCUXpresso Software and Tools
- CodeWarriorCodeWarrior
- MQX Software SolutionsMQX Software Solutions
- Model-Based Design Toolbox (MBDT)Model-Based Design Toolbox (MBDT)
- FreeMASTER
- eIQ Machine Learning Software
- Embedded Software and Tools Clinic
- S32 SDK
- S32 Design Studio
- Vigiles
- GUI Guider
- Zephyr Project
- Voice Technology
- Application Software Packs
- Secure Provisioning SDK (SPSDK)
- Processor Expert Software
-
- Topics
- Mobile Robotics - Drones and RoversMobile Robotics - Drones and Rovers
- NXP Training ContentNXP Training Content
- University ProgramsUniversity Programs
- Rapid IoT
- NXP Designs
- SafeAssure-Community
- OSS Security & Maintenance
- Using Our Community
-
- Cloud Lab Forums
-
- Home
- :
- i.MX Forums
- :
- i.MX Processors
- :
- Sporadic delay when using GPU with OpenCL
Sporadic delay when using GPU with OpenCL
- Subscribe to RSS Feed
- Mark Topic as New
- Mark Topic as Read
- Float this Topic for Current User
- Bookmark
- Subscribe
- Mute
- Printer Friendly Page
Sporadic delay when using GPU with OpenCL
- Mark as New
- Bookmark
- Subscribe
- Mute
- Subscribe to RSS Feed
- Permalink
- Report Inappropriate Content
I've got a imx8mqevk board and developing GPU processing applications with OpenCL.
Sporadicly I see big delays in executing kernels on the GPU.
Problem is also visable with the gtec-demo-framework. Executing the FastFourierTransform DemoApp I get in some runs such values:
Kernel execution time on GPU (kernel 0): 0.000003 seconds
Kernel execution time on GPU (kernel 1): 0.000615 seconds
Kernel execution time on GPU (kernel 2): 0.000002 seconds
Kernel execution time on GPU (kernel 3): 0.000002 seconds
Total Kernel execution time on GPU: 0.000622 seconds
I would expect such values:
Kernel execution time on GPU (kernel 0): 0.000003 seconds
Kernel execution time on GPU (kernel 1): 0.000001 seconds
Kernel execution time on GPU (kernel 2): 0.000002 seconds
Kernel execution time on GPU (kernel 3): 0.000002 seconds
Total Kernel execution time on GPU: 0.000008 seconds
I'm using
repo init -u https://source.codeaurora.org/external/imx/imx-manifest -b imx-linux-sumo -mimx-4.14.98-2.0.0_ga.xml
DISTRO=fsl-imx-xwayland MACHINE=imx8mqevk source fsl-setup-release.sh -b build-xwayland
Are there any problems within the imx-gpu-viv driver?
Or are there any other limitations?
- Mark as New
- Bookmark
- Subscribe
- Mute
- Subscribe to RSS Feed
- Permalink
- Report Inappropriate Content
Hi, what is /sys/devices/system/cpu/cpu0/cpufreq/scaling_governor on your board?
When I use performance or ondemand for your scaling_governor on my imx8qm board like this
echo performance | tee /sys/devices/system/cpu/cpu*/cpufreq/scaling_governor
The execution time is quite consistent.
My default scaling_governor is scheutil on my imx8qm board, yes, for many executions, I can see the the big spike for execution time from 1400 us to 2600us . But, most of time, they are consistent around 1500us. I think it is caused by cpu speed, not gpu. performance governor mode will make sure the consistent high cpu speed for cpu and gpu interactions.
Regards
- Mark as New
- Bookmark
- Subscribe
- Mute
- Subscribe to RSS Feed
- Permalink
- Report Inappropriate Content
Also Please, add the following line:
clFinish (commandQueue);
in clutil.cpp line 498 (end of runKernelFFT function) before the close statement. It will make the result more consistent. In my case I dont have the MQ board to test but I tested on 8QXP with fft length = 32:
Kernel execution time on GPU (kernel 0) : 0.000546 seconds
Kernel execution time on GPU (kernel 1) : 0.000655 seconds
Kernel execution time on GPU (kernel 2) : 0.000177 seconds
Kernel execution time on GPU (kernel 3) : 0.000650 seconds
Kernel execution time on GPU (kernel 4) : 0.000623 seconds
Total Kernel execution time on GPU : 0.002651 seconds
Kernel execution time on GPU (kernel 0) : 0.000544 seconds
Kernel execution time on GPU (kernel 1) : 0.000657 seconds
Kernel execution time on GPU (kernel 2) : 0.000176 seconds
Kernel execution time on GPU (kernel 3) : 0.000640 seconds
Kernel execution time on GPU (kernel 4) : 0.000621 seconds
Total Kernel execution time on GPU : 0.002638 seconds
Kernel execution time on GPU (kernel 0) : 0.000509 seconds
Kernel execution time on GPU (kernel 1) : 0.000644 seconds
Kernel execution time on GPU (kernel 2) : 0.000173 seconds
Kernel execution time on GPU (kernel 3) : 0.000628 seconds
Kernel execution time on GPU (kernel 4) : 0.000620 seconds
Total Kernel execution time on GPU : 0.002574 seconds
Kernel execution time on GPU (kernel 0) : 0.000541 seconds
Kernel execution time on GPU (kernel 1) : 0.000634 seconds
Kernel execution time on GPU (kernel 2) : 0.000180 seconds
Kernel execution time on GPU (kernel 3) : 0.000640 seconds
Kernel execution time on GPU (kernel 4) : 0.000621 seconds
Total Kernel execution time on GPU : 0.002616 seconds
Kernel execution time on GPU (kernel 0) : 0.000541 seconds
Kernel execution time on GPU (kernel 1) : 0.000643 seconds
Kernel execution time on GPU (kernel 2) : 0.000183 seconds
Kernel execution time on GPU (kernel 3) : 0.000631 seconds
Kernel execution time on GPU (kernel 4) : 0.000617 seconds
Total Kernel execution time on GPU : 0.002615 seconds
Kernel execution time on GPU (kernel 0) : 0.000540 seconds
Kernel execution time on GPU (kernel 1) : 0.000660 seconds
Kernel execution time on GPU (kernel 2) : 0.000180 seconds
Kernel execution time on GPU (kernel 3) : 0.000653 seconds
Kernel execution time on GPU (kernel 4) : 0.000627 seconds
Total Kernel execution time on GPU : 0.002660 seconds
Regards
- Mark as New
- Bookmark
- Subscribe
- Mute
- Subscribe to RSS Feed
- Permalink
- Report Inappropriate Content
Thank you for your response.
I didn't change any input parameters for now.
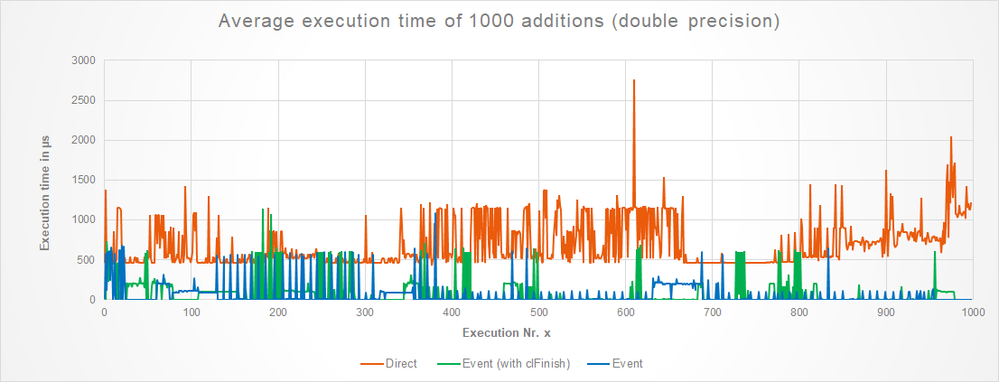
If the execution time result was a signal, we could decompose it into 3 major components:
- Consistent execution time: ~10µs ± 5µs
- Small spikes: ~100µs ± 50µs
- Big spikes: ~2000µs ± 1000µs
using clFinish in the following manner:
clFinish(..);
gettimeofday(&start, NULL);
err = clEnqueueNDRangeKernel(..., &hEvent);
clFinish(..);
if(err != 0) { //..error check.. /}
gettimeofday(&end, NULL);
Using clFinish(..) results mostly in elimintation of small spikes, those around ~100µs.
What remains is a mostly consistent signal with 15% big spikes at ~1000µs-1500µs.
Measuring exec. time with your "direct" measurement approach (in contrast to profiling information via cl_event "hEvent"),
results in a similar picture of exec times, but with a higher percentage of "big spikes" and an offset of all values around ~500µs.
I will probably ignore the spikes for now since the max. exec. time is "only" 1.2ms, but if it stacks up with more complex functions i need to find additional solutions.
- Mark as New
- Bookmark
- Subscribe
- Mute
- Subscribe to RSS Feed
- Permalink
- Report Inappropriate Content
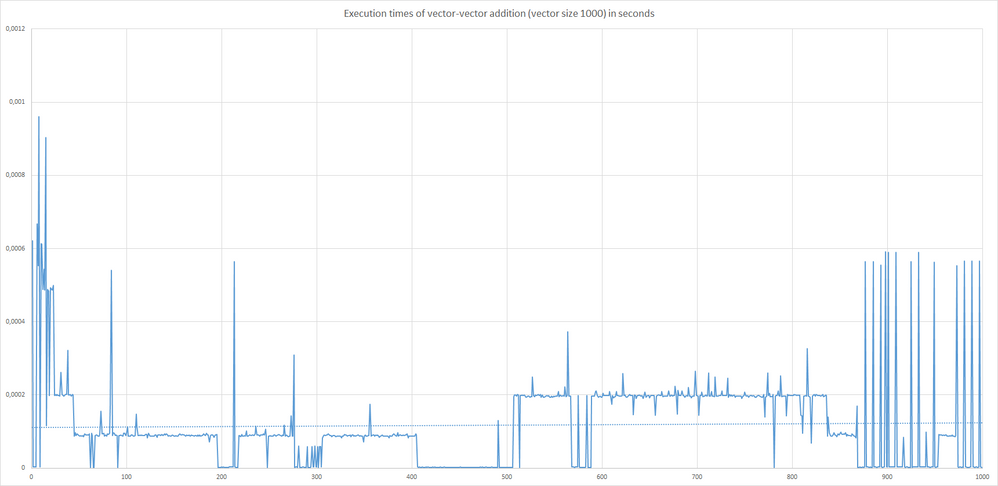
The graph shows the kernel execution times of a simple vector-vector additions with vector size 1000.
The addition was executed 1000 times.
My problem is the variance of values:
Min. exec. time: 2E-6 seconds
Max exec. time: 9.61E-4 seconds
Median: 9E-5 seconds
Even with 10E4 executions the max exec. times vary to around 2ms.
Execution Values are extracted through clGetEventProfilingInf() method (end-start timestamps).
Questions:
What causes this extreme variance of ~500%?
Is yocto linux a real-time operation system? -> Are possibly interrupts a cause of delay of enqueueing?
Am i measuring the timestamps correctly?
- Mark as New
- Bookmark
- Subscribe
- Mute
- Subscribe to RSS Feed
- Permalink
- Report Inappropriate Content
Hello,
Are you changing any of the arguments passed to cl kernel for each kernel execution? are the kernel parameters the same?
what do you get if not using wait for event when running the cl kernel like this:
gettimeofday(&start, NULL);
ret = clEnqueueNDRangeKernel (cq, kernel, dimension, NULL, global, local, 0, NULL, NULL);
if (ret == CL_SUCCESS)
{
printf( "\nReading data from GPU memory = ..\n");
}else
{
printf( "\nKernel failed = ..\n");
}
// Should be the barrier here?
clFinish(cq);
gettimeofday(&end, NULL);
//compute and print the elapsed time in millisec - For writting data into input buffer
seconds = end.tv_sec - start.tv_sec;
useconds = end.tv_usec - start.tv_usec;
mtime = ((seconds) * 1000 + useconds/1000.0) + 0.5;
printf( "\n CL code = %ld ms\n", mtime);
Regards
- Mark as New
- Bookmark
- Subscribe
- Mute
- Subscribe to RSS Feed
- Permalink
- Report Inappropriate Content
Hello peter,
Don´t know why you are getting limitations, but try to run again the code. On my Mx8M, I get 0.000008s.
Regards

