- Forums
- Product Forums
- General Purpose MicrocontrollersGeneral Purpose Microcontrollers
- i.MX Forumsi.MX Forums
- QorIQ Processing PlatformsQorIQ Processing Platforms
- Identification and SecurityIdentification and Security
- Power ManagementPower Management
- MCX Microcontrollers
- S32G
- S32K
- S32V
- MPC5xxx
- Other NXP Products
- Wireless Connectivity
- S12 / MagniV Microcontrollers
- Powertrain and Electrification Analog Drivers
- Sensors
- Vybrid Processors
- Digital Signal Controllers
- 8-bit Microcontrollers
- ColdFire/68K Microcontrollers and Processors
- PowerQUICC Processors
- OSBDM and TBDML
- S32M
-
- Solution Forums
- Software Forums
- MCUXpresso Software and ToolsMCUXpresso Software and Tools
- CodeWarriorCodeWarrior
- MQX Software SolutionsMQX Software Solutions
- Model-Based Design Toolbox (MBDT)Model-Based Design Toolbox (MBDT)
- FreeMASTER
- eIQ Machine Learning Software
- Embedded Software and Tools Clinic
- S32 SDK
- S32 Design Studio
- GUI Guider
- Zephyr Project
- Voice Technology
- Application Software Packs
- Secure Provisioning SDK (SPSDK)
- Processor Expert Software
- MCUXpresso Training Hub
-
- Topics
- Mobile Robotics - Drones and RoversMobile Robotics - Drones and Rovers
- NXP Training ContentNXP Training Content
- University ProgramsUniversity Programs
- Rapid IoT
- NXP Designs
- SafeAssure-Community
- OSS Security & Maintenance
- Using Our Community
-
- Cloud Lab Forums
-
- Knowledge Bases
- ARM Microcontrollers
- i.MX Processors
- Identification and Security
- Model-Based Design Toolbox (MBDT)
- QorIQ Processing Platforms
- S32 Automotive Processing Platform
- Wireless Connectivity
- CodeWarrior
- MCUXpresso Suite of Software and Tools
- MQX Software Solutions
-
- Home
- :
- i.MX Forums
- :
- i.MX Processors
- :
- Re: MIMXRT1061CVL5B: Run Debugging Session from QSPI NOR Flash
MIMXRT1061CVL5B: Run Debugging Session from QSPI NOR Flash
- Subscribe to RSS Feed
- Mark Topic as New
- Mark Topic as Read
- Float this Topic for Current User
- Bookmark
- Subscribe
- Mute
- Printer Friendly Page
- Mark as New
- Bookmark
- Subscribe
- Mute
- Subscribe to RSS Feed
- Permalink
- Report Inappropriate Content
Hello,
I intend to use the MCU MIMXRT1061CVL5B, and now I am examining its compatibility with the product's functions using the MIMRT1060-EVKB. One limitation that I have is the use of the OpenSDA, therefore I checked if I can boot the external flash with the USB-OGT and I was successful to do so using the flashloader with the elftosb and the MfgTool2. My question is, as in the development phase I need to run debugging sessions, how is it possible to do so from the external QSPI NOR Flash?
You can also simply refer me to sources that explain such things.
Thank you in advance.
Solved! Go to Solution.
- Mark as New
- Bookmark
- Subscribe
- Mute
- Subscribe to RSS Feed
- Permalink
- Report Inappropriate Content
Hi @Lukaz ,
If you need to debug the RT1061, you need the debugger at first.
If you are using the MIMXRT1060-EVKB board, it has the on board debugger directly, you can connect the opensda USB port, then the default debugger is CMSIS-DAP, you can open the SDK project, then debug it directly, the board need to enter the internal boot mode.
If you are using the customer board, you need to find an external debugger, eg, Segger JLINK, then through the SWD to debug the chip project.
We also have the application which may useful to you:
https://www.nxp.com/docs/en/nxp/application-notes/AN12183.pdf
Wish it helps you!
Best Regards,
kerry
- Mark as New
- Bookmark
- Subscribe
- Mute
- Subscribe to RSS Feed
- Permalink
- Report Inappropriate Content
Hi Kerry,
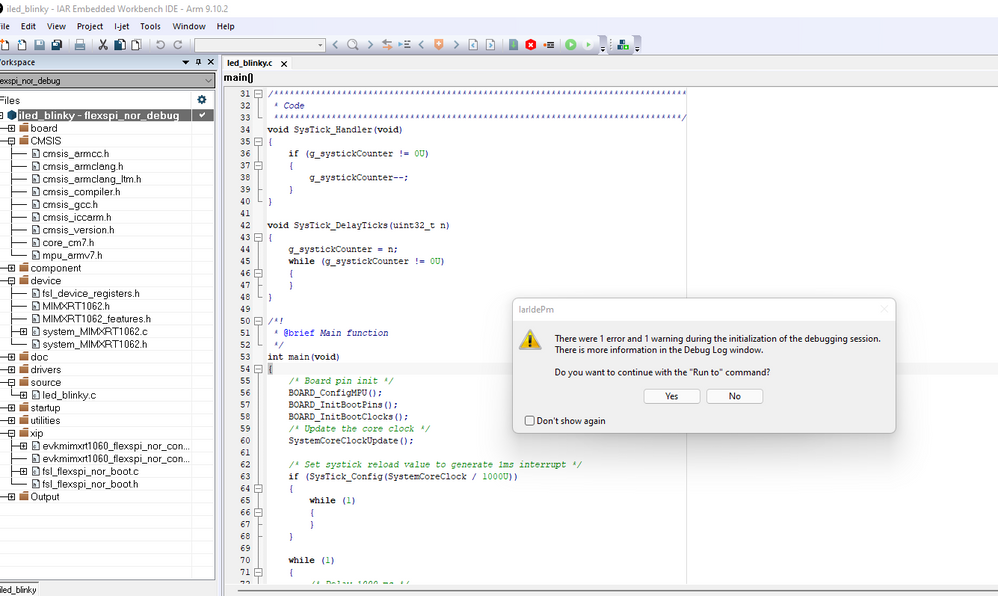
when I run the debugger session I get this message and I press yes to proceed and the debugging session works fine
but I was wondering if you have any idea why am I getting this message (below is the error message from the debug log)
Thanks
- Mark as New
- Bookmark
- Subscribe
- Mute
- Subscribe to RSS Feed
- Permalink
- Report Inappropriate Content
Hi @Lukaz ,
As I know, it is related to the IJET, as when I use the CMSIS DAP debugger, which is the RT1060-EVK default debugger in the IAR, it doesn't have this issues.
So, you can ignore that issue, just use it.
If you have any other issues, welcome to create the new question post.
Best Regards,
kerry
- Mark as New
- Bookmark
- Subscribe
- Mute
- Subscribe to RSS Feed
- Permalink
- Report Inappropriate Content
Thank you, it worked fine with me using I-JET debugger.
Just some points to clarify the solution. I have not disconnected any jumper from the board, I have connected J1 3-4 to use the USB-OTG port for power. The important thing was the debugger configurations (see screenshots below)


