- Forums
- Product Forums
- General Purpose MicrocontrollersGeneral Purpose Microcontrollers
- i.MX Forumsi.MX Forums
- QorIQ Processing PlatformsQorIQ Processing Platforms
- Identification and SecurityIdentification and Security
- Power ManagementPower Management
- Wireless ConnectivityWireless Connectivity
- RFID / NFCRFID / NFC
- Advanced AnalogAdvanced Analog
- MCX Microcontrollers
- S32G
- S32K
- S32V
- MPC5xxx
- Other NXP Products
- S12 / MagniV Microcontrollers
- Powertrain and Electrification Analog Drivers
- Sensors
- Vybrid Processors
- Digital Signal Controllers
- 8-bit Microcontrollers
- ColdFire/68K Microcontrollers and Processors
- PowerQUICC Processors
- OSBDM and TBDML
- S32M
- S32Z/E
-
- Solution Forums
- Software Forums
- MCUXpresso Software and ToolsMCUXpresso Software and Tools
- CodeWarriorCodeWarrior
- MQX Software SolutionsMQX Software Solutions
- Model-Based Design Toolbox (MBDT)Model-Based Design Toolbox (MBDT)
- FreeMASTER
- eIQ Machine Learning Software
- Embedded Software and Tools Clinic
- S32 SDK
- S32 Design Studio
- GUI Guider
- Zephyr Project
- Voice Technology
- Application Software Packs
- Secure Provisioning SDK (SPSDK)
- Processor Expert Software
- Generative AI & LLMs
-
- Topics
- Mobile Robotics - Drones and RoversMobile Robotics - Drones and Rovers
- NXP Training ContentNXP Training Content
- University ProgramsUniversity Programs
- Rapid IoT
- NXP Designs
- SafeAssure-Community
- OSS Security & Maintenance
- Using Our Community
-
- Cloud Lab Forums
-
- Knowledge Bases
- ARM Microcontrollers
- i.MX Processors
- Identification and Security
- Model-Based Design Toolbox (MBDT)
- QorIQ Processing Platforms
- S32 Automotive Processing Platform
- Wireless Connectivity
- CodeWarrior
- MCUXpresso Suite of Software and Tools
- MQX Software Solutions
- RFID / NFC
- Advanced Analog
-
- NXP Tech Blogs
- RSS フィードを購読する
- トピックを新着としてマーク
- トピックを既読としてマーク
- このトピックを現在のユーザーにフロートします
- ブックマーク
- 購読
- ミュート
- 印刷用ページ
MPC5748G Flash Problem
- 新着としてマーク
- ブックマーク
- 購読
- ミュート
- RSS フィードを購読する
- ハイライト
- 印刷
- 不適切なコンテンツを報告
Hi,
I'm experiencing a problem with MPC5748G Eval-Kit.
I flashed the controller via JTAG with the pemicro Multilink Universal FX. During that progress I accidently hit the reset button. I don't know when exactly the reset happened but I think during erasing. The MPC5748G now stays in reset mode (red LED, D1 stays on). I cannot connect via JTAG.
Now the question is: Is there any way to revive the controller? Do I need another debug tool (lauterbach or iSYSTEM)?
Thanks and regards,
Bernhard Dielhenn
- 新着としてマーク
- ブックマーク
- 購読
- ミュート
- RSS フィードを購読する
- ハイライト
- 印刷
- 不適切なコンテンツを報告
Hi Bernhard,
Use Lauterbach debugger is the easiest way how to connect, but there is another workaround.
Download and install CodeWarrior
http://cache.nxp.com/lgfiles/devsuites/PowerPC/CW55xx_v2_10_SE.exe
Download this patch and update the CodeWarrior according to Readme.txt file
http://www.pemicro.com/faqs/faq_view.cfm?id=211
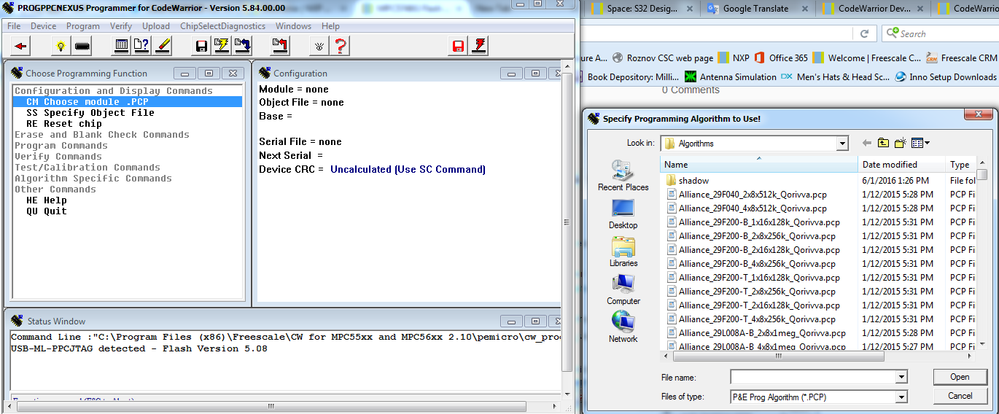
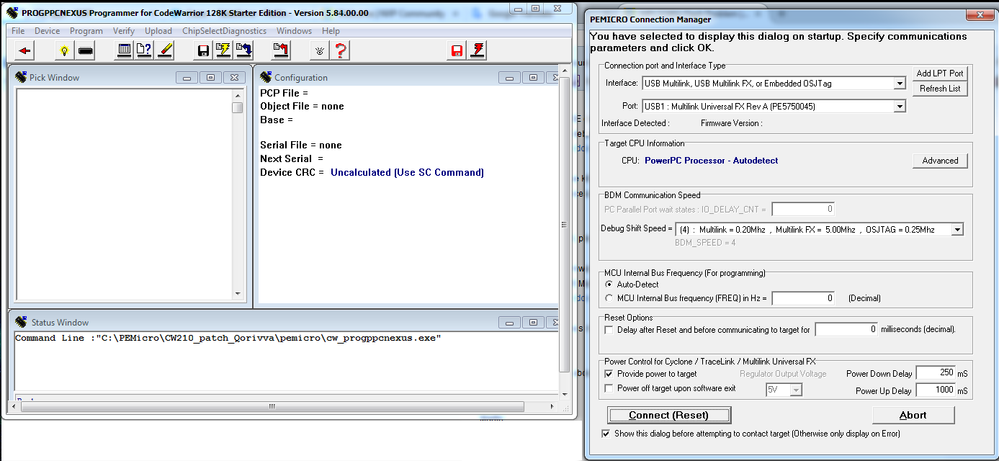
Run cw_progppcnexus.exe and click connect.
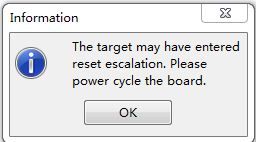
Popup window with reset escalation information appears. Do power on reset (switch board off and on and click OK).
After that, window with choosing algorithm appears. Click cancel.
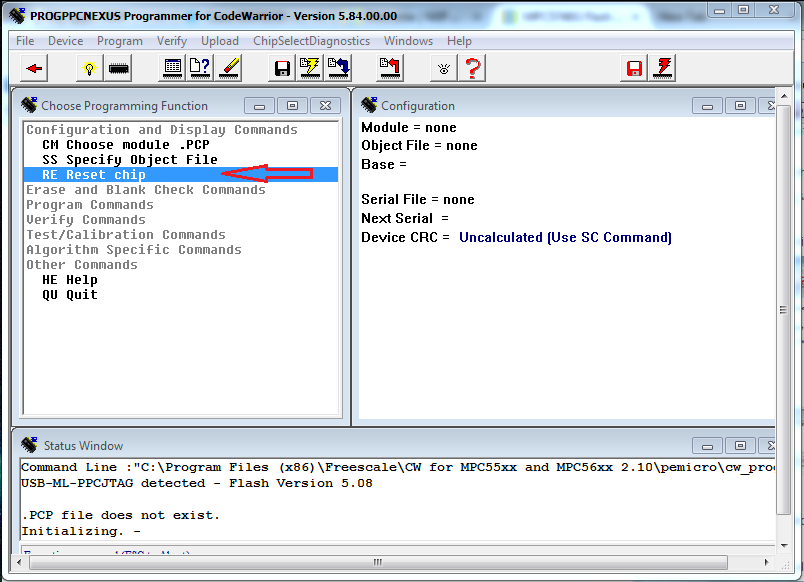
Now double click Reset chip.
Popup window with reset escalation information appears again. Do power on reset and click OK. Now you should be able to connect via PeMicro until next power on reset.
Please write me back if it helps you.
Regards,
Martin
- 新着としてマーク
- ブックマーク
- 購読
- ミュート
- RSS フィードを購読する
- ハイライト
- 印刷
- 不適切なコンテンツを報告
Hi Martin,
# Flash programming error due to CRC-16 mismatch file to device
I have the similar issues described below.
I am using S32 design studio and openSDA debudder to dubug sample application. It worked for 2 3 hours and after that the board is giving problem to load the programme.
It is stucks at verification of block. have a look at screen shot.
Connection from "127.0.0.1" via 127.0.0.1
Copyright 2017 P&E Microcomputer Systems,Inc.
Command Line :C:\NXP\S32DS_Power_v2017.R1\eclipse\plugins\com.pemicro.debug.gdbjtag.ppc_1.7.2.201709281658\win32\pegdbserver_power_console -device=MPC5748G -startserver -singlesession -serverport=7224 -gdbmiport=6224 -interface=OPENSDA -speed=5000 -resetÌ
CMD>RE
Initializing.
MPC574xC Device detected.
Target has been RESET and is active.
CMD>CM C:\NXP\S32DS_Power_v2017.R1\eclipse\plugins\com.pemicro.debug.gdbjtag.ppc_1.7.2.201709281658\win32\gdi\P&E\nxp_mpc5748g_1x32x1520k_cflash.pcp
Initializing.
MPC574xC Device detected.
Initialized.
;version 1.05, 06/26/2017, Copyright P&E Microcomputer Systems, www.pemicro.com [5748G_6080k]
;device NXP, MPC5748G, 1x32x1520k, desc=CFlash
;begin_cs device=$00F90000, length=$005F0000, ram=$40000000
Loading programming algorithm ...
WARNING - Selected .PCP file has been modified. CRC16 = $5A63
Done.
CMD>VC
Verifying object file CRC-16 to device ranges ...
block 00FA0000-00FA0007 ...
Please reply we have lost such 5 Devkits because this issue
regards,
Virbhadra H.
- 新着としてマーク
- ブックマーク
- 購読
- ミュート
- RSS フィードを購読する
- ハイライト
- 印刷
- 不適切なコンテンツを報告
Hi Martin,
I have also met this problem .There is a window poped up when i debugged the MPC5748G.
I built the project in S32D and used the Opensda debugger.
Could you tell me what's the reason of this situation? and how to sovle it ?Thanks very much!
Best Regards,
Yukun Wu.
- 新着としてマーク
- ブックマーク
- 購読
- ミュート
- RSS フィードを購読する
- ハイライト
- 印刷
- 不適切なコンテンツを報告
Hi,
first of all thank you very much for your answer. This is what I did so far:
- CodeWarrior installed
- PE Micro patch installed
- cw_progppcnexus.exe crashed
- I have two driver versions for PE Multilink FX
- 10.1.0.0 [26.01.2011]
- 12.2.0.0 [26.10.2015]
- after choosing the newer one, cw_progppcnexus.exe starts and after clicking connect I get the message refering reset escalation. When I power cycle the board and confirm the reset escalation message, the connection manager window comes up again. So I still cannot connect it.
Any idea what I can try?
Or as plan B, is there any way to purchase another PPC5748GMMN6A 1N81M? I really need a running Eval-Kit. This board had five weeks delivery time.
Thanks and regards
- 新着としてマーク
- ブックマーク
- 購読
- ミュート
- RSS フィードを購読する
- ハイライト
- 印刷
- 不適切なコンテンツを報告
Hi Bernhard,
this is strange. Which IDE (or tool) you use for flashing program? Is it S32 Design Studio? This issue could be caused by some active debug session. Just to make sure, did you download this patch?
http://www.pemicro.com/downloads/download_file.cfm?download_id=463
If you use S32DS, please kill pegdbserver_power_console.exe process and also powerpc-eabivle-gdb.exe process. Both these processes can block the connection. Kill both processes and restart cw_progppcnexus application.
If you do not use S32DS, please write me, which tool you use.
Also you can use PEFirmwareUpdater which is part of PEDrivers you can download from PEmicro website. This app is able to update PE Multilink FX firmware.
http://www.pemicro.com/downloads/download_file.cfm?download_id=346
I tried to do whole process mentioned above with USB-ML-PPCNEXUS and also with USB-ML-UNIVERSAL-FX and it works with both.
So please try the steps above and write me back if it helps.
Regards,
Martin
- 新着としてマーク
- ブックマーク
- 購読
- ミュート
- RSS フィードを購読する
- ハイライト
- 印刷
- 不適切なコンテンツを報告
Hi Martin,
I downloaded and installed the patch CW210_patch_Qorivva.zip.
I'm using S32DS and there are none of the mentioned processes running.
The PE Micro USB Multilink Universal FX has the latest firmware 9.40 on it. cw_progppcnexus detects that.
Thank you and regards
- 新着としてマーク
- ブックマーク
- 購読
- ミュート
- RSS フィードを購読する
- ハイライト
- 印刷
- 不適切なコンテンツを報告
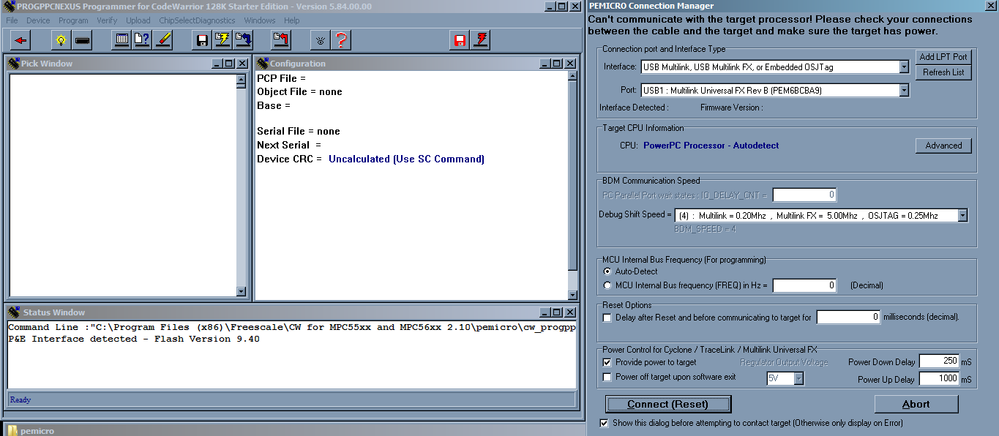
Hi,
could you please send the following screen from your side?
Regards,
Martin
- 新着としてマーク
- ブックマーク
- 購読
- ミュート
- RSS フィードを購読する
- ハイライト
- 印刷
- 不適切なコンテンツを報告
When I start cw_progppcnexus:
And after Connect and power cycle:
When I click on Reset, the yellow LED lights two times but the red one (from MCU) stays red all the time. So I think the MCU doesn't recognize the reset from PE Micro.
In S32DS I had to set up a Delay after Reset and before communication but this didn't help here.
Regards
- 新着としてマーク
- ブックマーク
- 購読
- ミュート
- RSS フィードを購読する
- ハイライト
- 印刷
- 不適切なコンテンツを報告
Hi Bernhard,
I think I finally found the problem (thank to my colleague). Please disconnect the jumper JP10 in Multilink Universal which is used for independent power supply. Now it should work correct.
Regards,
Martin
- 新着としてマーク
- ブックマーク
- 購読
- ミュート
- RSS フィードを購読する
- ハイライト
- 印刷
- 不適切なコンテンツを報告
Hi Martin,
thank you again for your efforts!
The jumper JP10 (on PE Multilink) was not connected all the time. The power supply comes only from the eval board. So power off and on at the eval board will remove power supply from the MPC5748G. During powercycle the red led switches off. But not after Reset from JTAG, maybe that wasn't clear after my last post.
I have no idea what else I can test. Is there any way to purchase the PPC5748GMMN6A 1N81M? Or would an iC5500 from iSYSTEM be helpful? I could get an Eval Trace probe for limitted time.
Thank you and regards
- 新着としてマーク
- ブックマーク
- 購読
- ミュート
- RSS フィードを購読する
- ハイライト
- 印刷
- 不適切なコンテンツを報告
Hi Bernhard,
from your last post I am little bit confused. After power on reset (without debugger), is D1 on or off (I suppose on)?
If D1 turns off (tell me the condition when D1 turn off, if ever), are you able to connect via S32DS?
About iC5500 i do not know this system, so I am not able to tell you any relevant information, but you can try.
New micro you can by at the following link:
MPC574xB/C/D/G|32-bit MCU|Gateway|NXP
Regards,
Martin
- 新着としてマーク
- ブックマーク
- 購読
- ミュート
- RSS フィードを購読する
- ハイライト
- 印刷
- 不適切なコンテンツを報告
Hi Martin,
sorry for confusing you. D1 is on all the time. I wanted to say, it switches off when I turn off the power supply from the eval board. This indicates for me that PE Multilink does not supply the board with power (JP10 is not set).
Usually if I enter the BDM mode the red LED would turn off. But I cannot enter BDM and the red LED stays on.
S32DS tells "The target may have entered reset escalation. Please power cycle the board." After doing that the connection manager appears again. After triyng to connect, reset escalation message comes up again and so on.
As I see it, there is no MAPBGA 324 pagacke available. So I would have to buy another Daughterboard.
Regards
- 新着としてマーク
- ブックマーク
- 購読
- ミュート
- RSS フィードを購読する
- ハイライト
- 印刷
- 不適切なコンテンツを報告
Hi Bernhard,
maybe one last desperate attempt. Please look at this thread, but I suppose you have done this step.
How to debug multicore with S32 Design studio
Regards,
Martin
- 新着としてマーク
- ブックマーク
- 購読
- ミュート
- RSS フィードを購読する
- ハイライト
- 印刷
- 不適切なコンテンツを報告
Hi Martin,
as I sayd I already tried to add a delay time. That worked for normal flashing but not here.
I think I cannot revive it with these tools (PE Micro + S32DS or CodeWarrior).
But thank you for helping.
Regards
- 新着としてマーク
- ブックマーク
- 購読
- ミュート
- RSS フィードを購読する
- ハイライト
- 印刷
- 不適切なコンテンツを報告
Hi Bernhard,
if you discovered the issue somehow (accidentally ;-) ), please write me back. I would like to know the root cause of the issue, because I tried 3 different debug probes and I was able to connect with all of them.
I regret we were not able to solve the issue, because I think the device is not censored (S32DS does not modify UTest flash). It remains a mystery for me, why you are not able to connect.
Regards,
Martin
- 新着としてマーク
- ブックマーク
- 購読
- ミュート
- RSS フィードを購読する
- ハイライト
- 印刷
- 不適切なコンテンツを報告
Hi,
I have now the lauterbach debugger on my desk. I tried the demo script and it says "debug port fail".
What can I try next?
Regards
Bernhard
- 新着としてマーク
- ブックマーク
- 購読
- ミュート
- RSS フィードを購読する
- ハイライト
- 印刷
- 不適切なコンテンツを報告
Hi Bernhard,
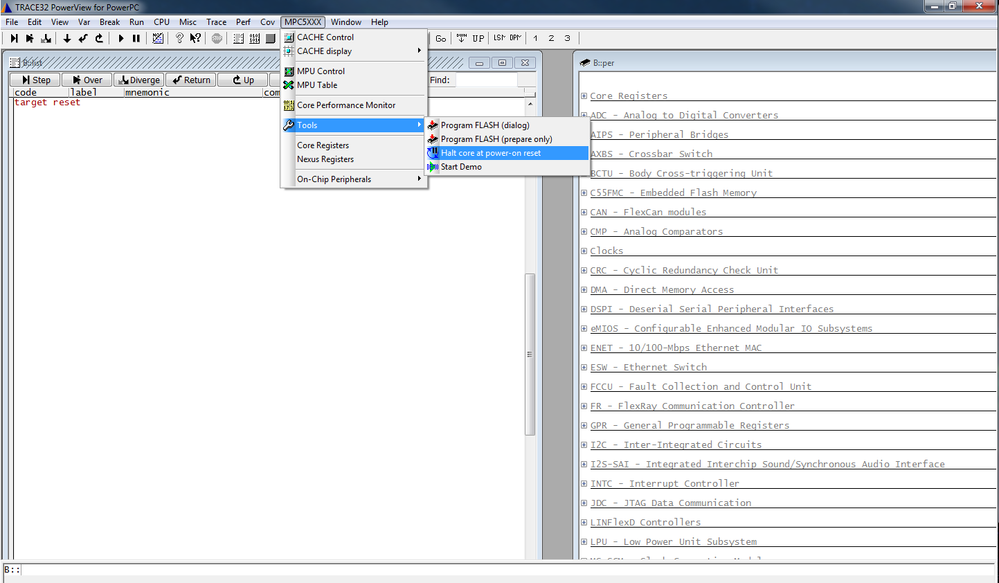
power up your board, and start Trace32. Now you are not able to attach - it is correct.
Click MPC5XXX->Tools->Halt core at power-on reset.
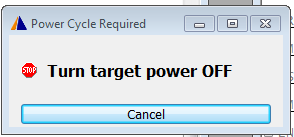
Now you should see following window:
Switch off the board, wait a while (a few seconds) and switch on the board. Now LED D1 has to be off.
Now you should see something like that (the window with code you show using command B::list, or click View->List Source):
Now click MPC5XXX->Tools->Program Flash(Dialog) and choose the elf you want to flash.
Regards,
Martin
- 新着としてマーク
- ブックマーク
- 購読
- ミュート
- RSS フィードを購読する
- ハイライト
- 印刷
- 不適切なコンテンツを報告
Hi Martin,
thank you for your quick and detailed reply.
After powerup the red LED (D1) stays on and Trace32 still says "debug port fail" and "unexpected error".
Regards,
Bernhard
- 新着としてマーク
- ブックマーク
- 購読
- ミュート
- RSS フィードを購読する
- ハイライト
- 印刷
- 不適切なコンテンツを報告
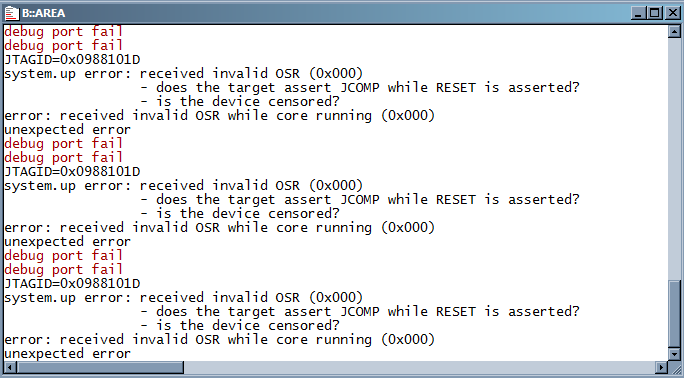
Hi Bernhard,
could you please send me screen of Message Area? Please click View->Message Area and send me the screen of the window.
Regards,
Martin
- 新着としてマーク
- ブックマーク
- 購読
- ミュート
- RSS フィードを購読する
- ハイライト
- 印刷
- 不適切なコンテンツを報告
Hi Martin,
here's the screen:
What does OSR and JCOMP mean?
Regards,
Bernhard

