- Forums
- Product Forums
- General Purpose MicrocontrollersGeneral Purpose Microcontrollers
- i.MX Forumsi.MX Forums
- QorIQ Processing PlatformsQorIQ Processing Platforms
- Identification and SecurityIdentification and Security
- Power ManagementPower Management
- Wireless ConnectivityWireless Connectivity
- RFID / NFCRFID / NFC
- Advanced AnalogAdvanced Analog
- MCX Microcontrollers
- S32G
- S32K
- S32V
- MPC5xxx
- Other NXP Products
- S12 / MagniV Microcontrollers
- Powertrain and Electrification Analog Drivers
- Sensors
- Vybrid Processors
- Digital Signal Controllers
- 8-bit Microcontrollers
- ColdFire/68K Microcontrollers and Processors
- PowerQUICC Processors
- OSBDM and TBDML
- S32M
- S32Z/E
-
- Solution Forums
- Software Forums
- MCUXpresso Software and ToolsMCUXpresso Software and Tools
- CodeWarriorCodeWarrior
- MQX Software SolutionsMQX Software Solutions
- Model-Based Design Toolbox (MBDT)Model-Based Design Toolbox (MBDT)
- FreeMASTER
- eIQ Machine Learning Software
- Embedded Software and Tools Clinic
- S32 SDK
- S32 Design Studio
- GUI Guider
- Zephyr Project
- Voice Technology
- Application Software Packs
- Secure Provisioning SDK (SPSDK)
- Processor Expert Software
- Generative AI & LLMs
-
- Topics
- Mobile Robotics - Drones and RoversMobile Robotics - Drones and Rovers
- NXP Training ContentNXP Training Content
- University ProgramsUniversity Programs
- Rapid IoT
- NXP Designs
- SafeAssure-Community
- OSS Security & Maintenance
- Using Our Community
-
- Cloud Lab Forums
-
- Knowledge Bases
- ARM Microcontrollers
- i.MX Processors
- Identification and Security
- Model-Based Design Toolbox (MBDT)
- QorIQ Processing Platforms
- S32 Automotive Processing Platform
- Wireless Connectivity
- CodeWarrior
- MCUXpresso Suite of Software and Tools
- MQX Software Solutions
- RFID / NFC
- Advanced Analog
-
- NXP Tech Blogs
- Home
- :
- MCUXpresso Software and Tools
- :
- MCUXpresso SDK Knowledge Base
- :
- Debugging Azure RTOS applications using TraceX
Debugging Azure RTOS applications using TraceX
- Subscribe to RSS Feed
- Mark as New
- Mark as Read
- Bookmark
- Subscribe
- Printer Friendly Page
- Report Inappropriate Content
Debugging Azure RTOS applications using TraceX
Debugging Azure RTOS applications using TraceX
1 TraceX Introduction
Azure RTOS TraceX is Microsoft’s host-based analysis tool that provides developers with a graphical view of real-time system events and enables them to visualize and better understand the behavior of their real-time systems. With Azure RTOS TraceX, developers can se clearly the occurrence of system events like interrupts and context switches that occur out of view of standard debugging tools.
This article explains how to start the traceX debug with MCUXpresso SDK
Hardware: MIMXRT1060-EVK & 1 Micro-USB cable
Software: SDK_2_10_1_EVK-MIMXRT1060
2 Installing TraceX
You can obtain the TraceX app from the Microsoft App Store by searching for TraceX, or by going directly to the TraceX page. Then install the TraceX according to the pop up manuals.
3 Enabling Trace Inside the application
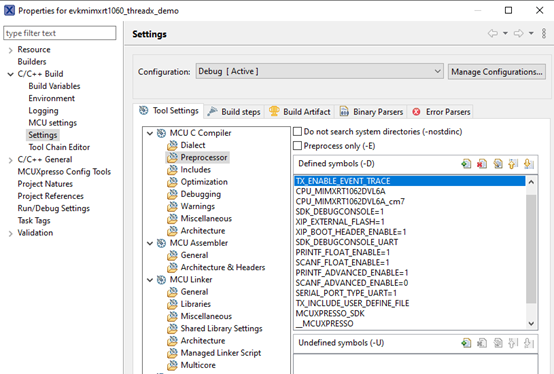
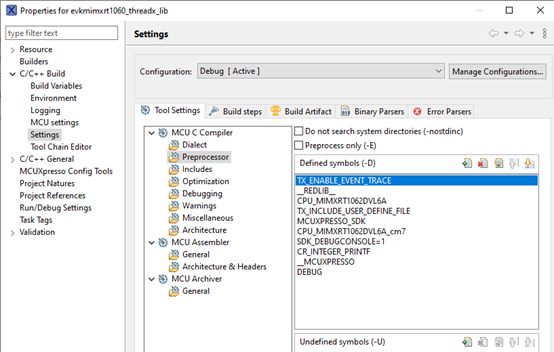
3.1 Add required preprocessor symbols
Trace-dependent code is activated using TX_ENABLE_EVENT_TRACE define. It must be added in the preprocessor section of the compiler. This must be done for the application itself and for the linked libraries. (e.g. ThreadX library)
3.2 Declare the trace buffer
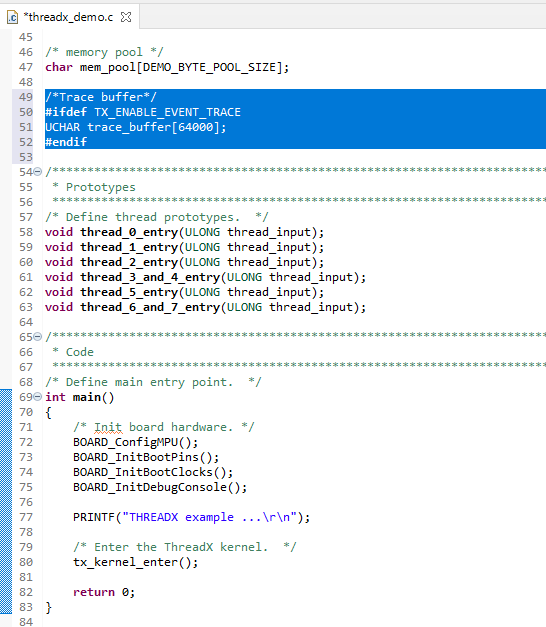
A buffer area for storing the trace events occurring at run-time must be specified and then further instruct the ThreadX trace sub-system to use it. Buffer can be a global variable, just like in the example below:
/*Trace buffer*/
#ifdef TX_ENABLE_EVENT_TRACE
UCHAR trace_buffer[64000];
#endif
3.3 Enable trace
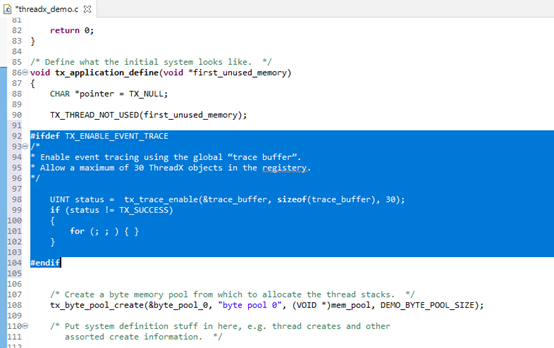
Trace must be explicitly enabled inside the application by calling tx_trace_enable(). This can be achieved by adding the below code.
#ifdef TX_ENABLE_EVENT_TRACE
/*
* Enable event tracing using the global “trace buffer”.
* Allow a maximum of 30 ThreadX objects in the registery.
*/
UINT status = tx_trace_enable(&trace_buffer, sizeof(trace_buffer), 30);
if (status != TX_SUCCESS)
{
for (; ; ) { }
}
#endif
It is recommended to enable trace inside tx_application_define( ).
3.4 compile
Compile the ThreadX lib (the compiled library will be in the Debug folder).
After successful build and compilation, a new library appears in the Debug / Release directory. It has a name like libevkimixrt1060_threadx_lib.a.
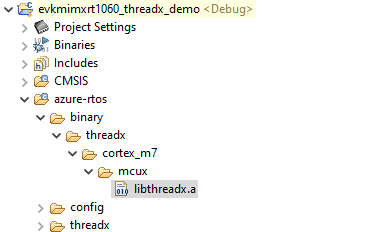
Please rename it to libthreadx.a and copy it to the directory, azure-rtos/binary/treadx/mcux/, in the evkmimxrt1060_threadx_demo project to replace the original one.
Replace the libthreadx.a files in the threadx_demo project

4 Exporting Trace
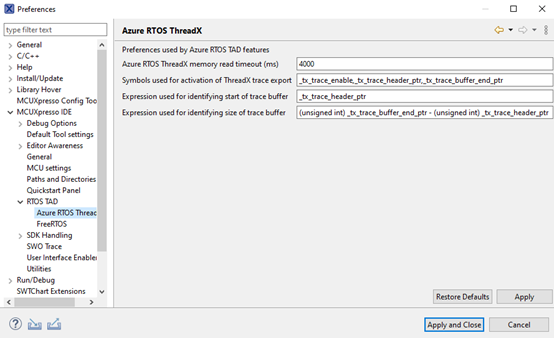
4.1 Configuration of Trace Export feature
Trace Export feature is controlled by a list of preferences that can be accessed and further modified via window->Preference page.
4.2 Trace Export button
Pause your application and the Trace Export button is located in the Debug view’s toolbar, as illustrated in the screenshot below.

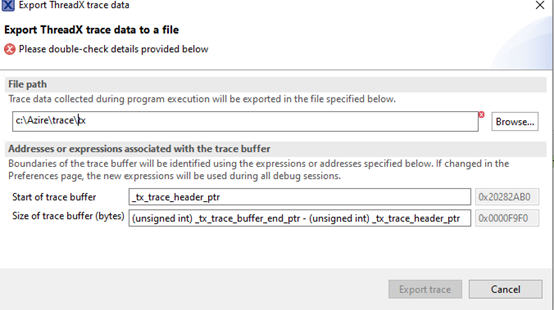
4.3 Exporting Trace
Once the Trace Expert button is clicked, a modal dialog window will be presented. A file path must be specified and then click the Export button. The exported file can be imported in Azure RTOS TraceX tool afterwards.
5 Display with Azure RTOS TraceX tool
From Azure RTOS TraceX, we can open the imported file.
System summary line contains a summary of the context as well as the corresponding event summary underneath.
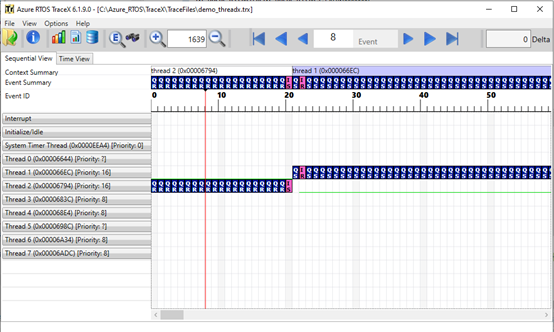
Azure RTOS TraceX provides a built-in execution profile for all executed contexs
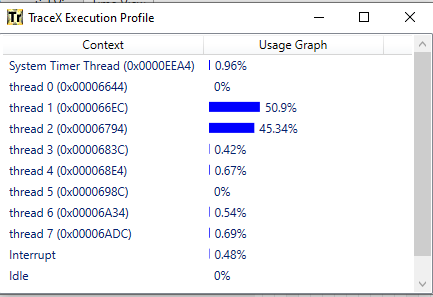
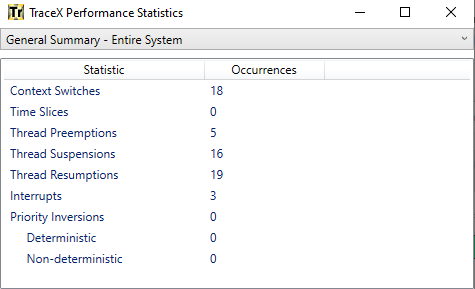
Azure RTOS TraceX provides a build in performance statistics report for the currently loaded trace file
Reference doc:
https://docs.microsoft.com/en-us/azure/rtos/