- Forums
- Product Forums
- General Purpose MicrocontrollersGeneral Purpose Microcontrollers
- i.MX Forumsi.MX Forums
- QorIQ Processing PlatformsQorIQ Processing Platforms
- Identification and SecurityIdentification and Security
- Power ManagementPower Management
- Wireless ConnectivityWireless Connectivity
- RFID / NFCRFID / NFC
- Advanced AnalogAdvanced Analog
- MCX Microcontrollers
- S32G
- S32K
- S32V
- MPC5xxx
- Other NXP Products
- S12 / MagniV Microcontrollers
- Powertrain and Electrification Analog Drivers
- Sensors
- Vybrid Processors
- Digital Signal Controllers
- 8-bit Microcontrollers
- ColdFire/68K Microcontrollers and Processors
- PowerQUICC Processors
- OSBDM and TBDML
- S32M
- S32Z/E
-
- Solution Forums
- Software Forums
- MCUXpresso Software and ToolsMCUXpresso Software and Tools
- CodeWarriorCodeWarrior
- MQX Software SolutionsMQX Software Solutions
- Model-Based Design Toolbox (MBDT)Model-Based Design Toolbox (MBDT)
- FreeMASTER
- eIQ Machine Learning Software
- Embedded Software and Tools Clinic
- S32 SDK
- S32 Design Studio
- GUI Guider
- Zephyr Project
- Voice Technology
- Application Software Packs
- Secure Provisioning SDK (SPSDK)
- Processor Expert Software
- Generative AI & LLMs
-
- Topics
- Mobile Robotics - Drones and RoversMobile Robotics - Drones and Rovers
- NXP Training ContentNXP Training Content
- University ProgramsUniversity Programs
- Rapid IoT
- NXP Designs
- SafeAssure-Community
- OSS Security & Maintenance
- Using Our Community
-
- Cloud Lab Forums
-
- Knowledge Bases
- ARM Microcontrollers
- i.MX Processors
- Identification and Security
- Model-Based Design Toolbox (MBDT)
- QorIQ Processing Platforms
- S32 Automotive Processing Platform
- Wireless Connectivity
- CodeWarrior
- MCUXpresso Suite of Software and Tools
- MQX Software Solutions
- RFID / NFC
- Advanced Analog
-
- NXP Tech Blogs
- Home
- :
- MCUXpresso Software and Tools
- :
- MCUXpresso IDE
- :
- FreeRTOS Thread Aware Debugging shows 0x0 as call stack
FreeRTOS Thread Aware Debugging shows 0x0 as call stack
- Subscribe to RSS Feed
- Mark Topic as New
- Mark Topic as Read
- Float this Topic for Current User
- Bookmark
- Subscribe
- Mute
- Printer Friendly Page
FreeRTOS Thread Aware Debugging shows 0x0 as call stack
- Mark as New
- Bookmark
- Subscribe
- Mute
- Subscribe to RSS Feed
- Permalink
- Report Inappropriate Content
Hello,
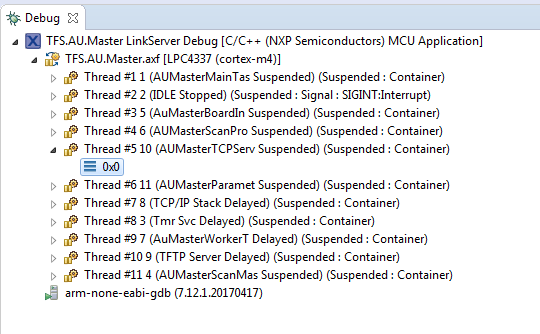
while using MCUXpresso, when pausing our application, the debug view shows 0x0 for a thread instead of a call stack. So the question is, what means 0x0?
Thanks for help, Sven
- Mark as New
- Bookmark
- Subscribe
- Mute
- Subscribe to RSS Feed
- Permalink
- Report Inappropriate Content
A problem was identified in the FreeRTOS stack backtrace support. This will be fixed in the next release. We apologize for the inconvenience.
Thanks and regards,
MCUXpresso Support
- Mark as New
- Bookmark
- Subscribe
- Mute
- Subscribe to RSS Feed
- Permalink
- Report Inappropriate Content
Was this issue resolved in the MCUXpresso version 11.1.1?
Regards,
Disha
- Mark as New
- Bookmark
- Subscribe
- Mute
- Subscribe to RSS Feed
- Permalink
- Report Inappropriate Content
Hi,
Yes, this issue is fixed in 11.1.1.
Greetings,
MCUXpresso IDE Support
- Mark as New
- Bookmark
- Subscribe
- Mute
- Subscribe to RSS Feed
- Permalink
- Report Inappropriate Content
Can you provide a FreeRTOS project which demonstrates this result?
Thanks and regards,
MCUXpresso Support
- Mark as New
- Bookmark
- Subscribe
- Mute
- Subscribe to RSS Feed
- Permalink
- Report Inappropriate Content
Dear Support,
I think we have figured out the cause of the problem: It seems like as soon as we use any floating point operations in our code, and a FreeRTOS task switch occurs thereafter, then the call stack of the thread which used the FPU shows 0x0.
Therefore we checked the FreeRTOS task switching code, and realized that additional registers are stored onto the stack when the FPU was used (port.c => xPortPendSVHandler):
" tst r14, #0x10 \n" /* Is the task using the FPU context? If so, push high vfp registers. */
" it eq \n"
" vstmdbeq r0!, {s16-s31} \n"
Could this be the reason that MCUXpresso cannot unwind the stack, when paused after a task switch?
Thank you and best regards.
- Mark as New
- Bookmark
- Subscribe
- Mute
- Subscribe to RSS Feed
- Permalink
- Report Inappropriate Content
This information has the potential to significantly narrow the possibilities. We'll let you know what we find.
Thanks and regards,
MCUXpresso Support
- Mark as New
- Bookmark
- Subscribe
- Mute
- Subscribe to RSS Feed
- Permalink
- Report Inappropriate Content
Insufficient stack allocation for a thread, or a write from a bad pointer value can corrupt FreeRTOS data structures the stack backtrace relies on. Also check the heap size. These are the first places I normally look. I'll let you know if there's another clue in your attachments.
Thanks and regards,
MCUXpresso Support
- Mark as New
- Bookmark
- Subscribe
- Mute
- Subscribe to RSS Feed
- Permalink
- Report Inappropriate Content
The debug log, as is, doesn't add information. Edit the launch configuration and set the Debug Level to 4. You can also turn on Extended Debug Trace. See Windows -> Preferences -> MCUXpresso IDE -> Debug Options (MIscellaneous). Use a value like 0x3FFFF for maximum logging. Then, repeat the debug session(s). Next post, please include the gdb-traces console, debug log, and the.map file from the build.
Thanks and regards,
MCUXpresso Support
- Mark as New
- Bookmark
- Subscribe
- Mute
- Subscribe to RSS Feed
- Permalink
- Report Inappropriate Content
Dear Support,
I have repeated the debug session, with the recommended settings.
I paused twice. The first time one could see the stack traces, as per usual. Then some time later (ca. 30s), the AUMasterTCPServ Thread showed 0x0 again. In the GDB-Console, one can see the following line:
205,896 85^done,threads=[{id="6",target-id="Thread 10",details="AUMasterTCPServ Suspended",frame={level="0",addr="0x00000000",func="??",args=[]},state="stopped"}]
This seems to be the place where it is broken.
I am not sure how the stack unwinding is done, but could it be that some memory leak has caused this problem? The strange thing is, that even though this thread cannot be displayed, when execution is continued, everything seems to be "fine".
We do however, under much more complex circumstances, have the problem that this particular thread deadlocks. This is how we realized that we could not see what this thread is doing in the first place.
Thank you and best regards.
- Mark as New
- Bookmark
- Subscribe
- Mute
- Subscribe to RSS Feed
- Permalink
- Report Inappropriate Content
Do you see the same result after hitting a breakpoint you've set in the thread? Is this particular thread the only manifestation of the problem, or do you see a zero in the stack trace back in other threads?
As a first step, please copy the contents of the gdb-traces console, and debug log The Debug Log and post here.
Thanks and regards,
MCUXpresso Support
- Mark as New
- Bookmark
- Subscribe
- Mute
- Subscribe to RSS Feed
- Permalink
- Report Inappropriate Content
Dear Support,
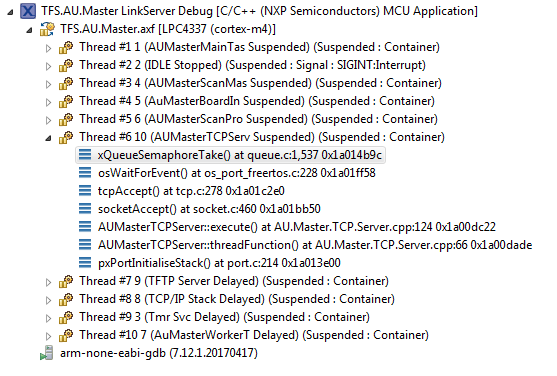
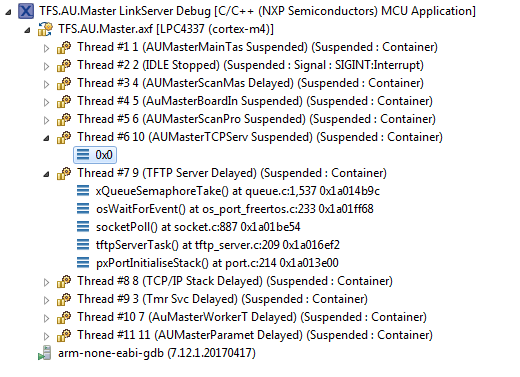
I have attached a screenshot and the debug text when debugging was still working:
Debug Console:
MCUXpresso RedlinkMulti Driver v10.1 (Dec 19 2017 16:58:35 - crt_emu_cm_redlink build 390)
Found chip XML file in ....../Debug\LPC4337.xml
Reconnected to existing redlink server (PID 4294967295)
Connecting to probe 1 core 0 (server PID unknown) gave 'OK'
Probe Firmware: LPC-LINK2 CMSIS-DAP V5.183 (NXP Semiconductors)
Serial Number: JQDYI2KT
VID:PID: 1FC9:0090
USB Path: \\?\hid#vid_1fc9&pid_0090&mi_00#7&1196c9fa&0&0000#{4d1e55b2-f16f-11cf-88cb-001111000030}
Vector catch on SYSRESETREQ signal
debug interface type = Cortex-M3/4 (DAP DP ID 2BA01477) over SWD
processor type = Cortex-M4 (CPU ID 410FC240)
number of h/w breakpoints = 6
number of flash patches = 2
number of h/w watchpoints = 4
Probe(0): Connected&Reset. DpID: 2BA01477. CpuID: 410FC240. Info: <None>
Debug protocol: SWD. RTCK: Disabled. Vector catch: Enabled.
Content of CoreSight Debug ROM(s):
RBASE E00FF000: CID B105100D PID 04000BB4C4 ROM dev (type 0x1)
ROM 1 E000E000: CID B105E00D PID 04000BB00C ChipIP dev SCS (type 0x0)
ROM 1 E0001000: CID B105E00D PID 04003BB002 ChipIP dev DWT (type 0x0)
ROM 1 E0002000: CID B105E00D PID 04002BB003 ChipIP dev FPB (type 0x0)
ROM 1 E0000000: CID B105E00D PID 04003BB001 ChipIP dev ITM (type 0x0)
ROM 1 E0040000: CID B105900D PID 04000BB9A1 CoreSight dev TPIU type 0x11 Trace Sink - TPIU
ROM 1 E0041000: CID B105900D PID 04000BB925 CoreSight dev ETM type 0x13 Trace Source - core
Inspected v.2 On-chip Flash Memory LPC18x7_43x7_2x512_BootA.cfx
Image 'LPC18x7/LPC43x7 2x512KB (Boot Bank A) Nov 14 2017 14:59:32'
NXP: LPC4337
Connected: was_reset=true. was_stopped=false
MCUXpressoPro Full License - Unlimited
Awaiting telnet connection to port 3330 ...
GDB nonstop mode disabled (using allstop mode)
FreeRTOS stack backtrace is enabled
Opening flash driver LPC18x7_43x7_2x512_BootA.cfx
Sending VECTRESET to run flash driver
Writing 264160 bytes to address 0x1A000000 in Flash
Erased/Wrote page 0-11 with 264160 bytes in 2103msec
Closing flash driver LPC18x7_43x7_2x512_BootA.cfx
Flash Write Done
Flash Program Summary: 264160 bytes in 2.10 seconds (122.67 KB/sec)
============= SCRIPT: LPC18LPC43InternalFLASHBootResetscript.scp =============
Boot from FLASH image pc/sp reset script
PC = 0x1A010EC9
SP = 0x10008000
XPSR = 0x01000000
VTOR = 0x00000000
============= END SCRIPT =====================================================
Stopped: Halt
Then about 30 seconds later after three additional halts(In the mean time, some TCP communications took place) :
Debug Console:
MCUXpresso RedlinkMulti Driver v10.1 (Dec 19 2017 16:58:35 - crt_emu_cm_redlink build 390)
Found chip XML file in ......\LPC4337.xml
Reconnected to existing redlink server (PID 4294967295)
Connecting to probe 1 core 0 (server PID unknown) gave 'OK'
Probe Firmware: LPC-LINK2 CMSIS-DAP V5.183 (NXP Semiconductors)
Serial Number: JQDYI2KT
VID:PID: 1FC9:0090
USB Path: \\?\hid#vid_1fc9&pid_0090&mi_00#7&1196c9fa&0&0000#{4d1e55b2-f16f-11cf-88cb-001111000030}
Vector catch on SYSRESETREQ signal
debug interface type = Cortex-M3/4 (DAP DP ID 2BA01477) over SWD
processor type = Cortex-M4 (CPU ID 410FC240)
number of h/w breakpoints = 6
number of flash patches = 2
number of h/w watchpoints = 4
Probe(0): Connected&Reset. DpID: 2BA01477. CpuID: 410FC240. Info: <None>
Debug protocol: SWD. RTCK: Disabled. Vector catch: Enabled.
Content of CoreSight Debug ROM(s):
RBASE E00FF000: CID B105100D PID 04000BB4C4 ROM dev (type 0x1)
ROM 1 E000E000: CID B105E00D PID 04000BB00C ChipIP dev SCS (type 0x0)
ROM 1 E0001000: CID B105E00D PID 04003BB002 ChipIP dev DWT (type 0x0)
ROM 1 E0002000: CID B105E00D PID 04002BB003 ChipIP dev FPB (type 0x0)
ROM 1 E0000000: CID B105E00D PID 04003BB001 ChipIP dev ITM (type 0x0)
ROM 1 E0040000: CID B105900D PID 04000BB9A1 CoreSight dev TPIU type 0x11 Trace Sink - TPIU
ROM 1 E0041000: CID B105900D PID 04000BB925 CoreSight dev ETM type 0x13 Trace Source - core
Inspected v.2 On-chip Flash Memory LPC18x7_43x7_2x512_BootA.cfx
Image 'LPC18x7/LPC43x7 2x512KB (Boot Bank A) Nov 14 2017 14:59:32'
NXP: LPC4337
Connected: was_reset=true. was_stopped=false
MCUXpressoPro Full License - Unlimited
Awaiting telnet connection to port 3330 ...
GDB nonstop mode disabled (using allstop mode)
FreeRTOS stack backtrace is enabled
Opening flash driver LPC18x7_43x7_2x512_BootA.cfx
Sending VECTRESET to run flash driver
Writing 264160 bytes to address 0x1A000000 in Flash
Erased/Wrote page 0-11 with 264160 bytes in 2103msec
Closing flash driver LPC18x7_43x7_2x512_BootA.cfx
Flash Write Done
Flash Program Summary: 264160 bytes in 2.10 seconds (122.67 KB/sec)
============= SCRIPT: LPC18LPC43InternalFLASHBootResetscript.scp =============
Boot from FLASH image pc/sp reset script
PC = 0x1A010EC9
SP = 0x10008000
XPSR = 0x01000000
VTOR = 0x00000000
============= END SCRIPT =====================================================
Stopped: Halt
Stopped: Halt
Stopped: Halt
Stopped: Halt
Only the three additional halts were added into the debug console.
Many Thanks
- Mark as New
- Bookmark
- Subscribe
- Mute
- Subscribe to RSS Feed
- Permalink
- Report Inappropriate Content
Based on an earlier investigation, it's possible the thread hasn't gotten a chance to run yet.
Thanks and regards,
MCUXpresso Support
- Mark as New
- Bookmark
- Subscribe
- Mute
- Subscribe to RSS Feed
- Permalink
- Report Inappropriate Content
The thread was running and it's possible to set a break point in the thread. The thread stops there and shows a call stack. The 0x0 only occurs when pressing pause.
- Mark as New
- Bookmark
- Subscribe
- Mute
- Subscribe to RSS Feed
- Permalink
- Report Inappropriate Content
Have you reviewed the recommended debug settings documented in the MCUXpresso_IDE_FreeRTOS_Debug_Guide.pdf guide? This document is included in your installation. The main question is whether you're debugging in Non-stop or All-stop mode?
Thanks and regards,
MCUXpresso Support
- Mark as New
- Bookmark
- Subscribe
- Mute
- Subscribe to RSS Feed
- Permalink
- Report Inappropriate Content
I've followed all the steps in the document. All-stop mode was enabled (otherwise I could'nt see all threads in the debug view). I've also used the latest FreeRTOS release 10.0.1 and MCUXpresso release 10.1.1. with a pro license.
Any idea?
Thanks and regards,
Sven


