- NXP Forums
- Product Forums
- General Purpose MicrocontrollersGeneral Purpose Microcontrollers
- i.MX Forumsi.MX Forums
- QorIQ Processing PlatformsQorIQ Processing Platforms
- Identification and SecurityIdentification and Security
- Power ManagementPower Management
- MCX Microcontrollers
- S32G
- S32K
- S32V
- MPC5xxx
- Other NXP Products
- Wireless Connectivity
- S12 / MagniV Microcontrollers
- Powertrain and Electrification Analog Drivers
- Sensors
- Vybrid Processors
- Digital Signal Controllers
- 8-bit Microcontrollers
- ColdFire/68K Microcontrollers and Processors
- PowerQUICC Processors
- OSBDM and TBDML
-
- Solution Forums
- Software Forums
- MCUXpresso Software and ToolsMCUXpresso Software and Tools
- CodeWarriorCodeWarrior
- MQX Software SolutionsMQX Software Solutions
- Model-Based Design Toolbox (MBDT)Model-Based Design Toolbox (MBDT)
- FreeMASTER
- eIQ Machine Learning Software
- Embedded Software and Tools Clinic
- S32 SDK
- S32 Design Studio
- GUI Guider
- Zephyr Project
- Voice Technology
- Application Software Packs
- Secure Provisioning SDK (SPSDK)
- Processor Expert Software
-
- Topics
- Mobile Robotics - Drones and RoversMobile Robotics - Drones and Rovers
- NXP Training ContentNXP Training Content
- University ProgramsUniversity Programs
- Rapid IoT
- NXP Designs
- SafeAssure-Community
- OSS Security & Maintenance
- Using Our Community
-
- Cloud Lab Forums
-
- Home
- :
- Software Forums
- :
- FreeMASTER
- :
- Re: variable watch not update in the freemaster 3.2.2.2
variable watch not update in the freemaster 3.2.2.2
- Subscribe to RSS Feed
- Mark Topic as New
- Mark Topic as Read
- Float this Topic for Current User
- Bookmark
- Subscribe
- Mute
- Printer Friendly Page
variable watch not update in the freemaster 3.2.2.2
- Mark as New
- Bookmark
- Subscribe
- Mute
- Subscribe to RSS Feed
- Permalink
- Report Inappropriate Content
the target hardware is S32K388 and the behavior is same on NXP S32K388 EVB and our own designed HW.
The test code on the target is incrementing the test_counter to 100 then back to 0.
I tested with debugger, the code runs OK.
I tried to define the variable as static volatile or just static.
But the value never change in the freemaster.
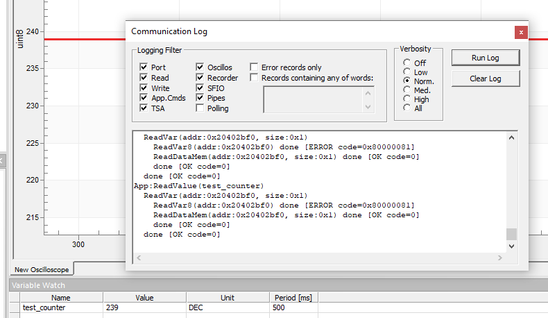
And by checking the log, I can see there is error code 0x80000081
please help to provide some ideas what is going wrong.
I’m using JLink plugin as the communication method.
- Mark as New
- Bookmark
- Subscribe
- Mute
- Subscribe to RSS Feed
- Permalink
- Report Inappropriate Content
Hi @Panasonic_Kevin_Yang, @DouDou1,
We are looking into this issue. In the meantime could you provide some details about the following:
- Are you facing this issue when the application is loaded into Flash or Sram, or both ?
- Are you running an active debug session at the same time you use FreeMASTER ?
- Mark as New
- Bookmark
- Subscribe
- Mute
- Subscribe to RSS Feed
- Permalink
- Report Inappropriate Content
I found that every S32DS program creates a variable called exit_code and decides if it is equal to 0 in the main loop. When I call freemaster, this variable is changed, and the program is finished
- Mark as New
- Bookmark
- Subscribe
- Mute
- Subscribe to RSS Feed
- Permalink
- Report Inappropriate Content
- Mark as New
- Bookmark
- Subscribe
- Mute
- Subscribe to RSS Feed
- Permalink
- Report Inappropriate Content
You can try to see if the variable has changed, and if it has, then the program will not proceed
- Mark as New
- Bookmark
- Subscribe
- Mute
- Subscribe to RSS Feed
- Permalink
- Report Inappropriate Content
Hi,
It seems that JLink performs some default operations on connect. Ex: memory initialization - in this case the behavior you observe may depend on your particular application (what is stored in those regions).
Example logs:
SetupTarget() start
Initializing ECC RAM...
  RAMCodeAddr: 0x20000000
  RAMInitAddr: 0x20000010
  RAMInitSize: 0x00007FF0
  InitPattern: 0xDEADBEEF
  ECC RAM initialized successfully
Initializing ECC RAM...
  RAMCodeAddr: 0x20000000
  RAMInitAddr: 0x20400000
  RAMInitSize: 0x00004000
  InitPattern: 0xDEADBEEF
  ECC RAM initialized successfully
SetupTarget() end - Took 25.3ms
We are yet to confirm whether it's the root cause. If so, this could possibly be disabled with JLink Scripts as described on JLink's Wiki page.
- Mark as New
- Bookmark
- Subscribe
- Mute
- Subscribe to RSS Feed
- Permalink
- Report Inappropriate Content
the behavior remains the same, below is the log showing the script has been ran.
03-00000000-00-00000001-01C1: ------J-Link related settings------
J-Link Host interface: USB
J-Link script: **********************************\Example_InitTargetOverride.JLinkScript
J-Link settings file: none
------Target related settings------
Target device: S32K388
Target device parameters: none
Target interface: JTAG
Target interface speed: 4000kHz
Target endian: little
- Mark as New
- Bookmark
- Subscribe
- Mute
- Subscribe to RSS Feed
- Permalink
- Report Inappropriate Content
Hello,
what Iulian wrote above is important, the JLink may corrupt a memory by initializing it to the 0xDEADBEEF pattern and causing a HardFault. Using a custom JLinkScript which overrides the SetupTarget might be necessary.
I was observing slightly similar (but still different) behavior on S32K344. It appears that there might be a DebugEvent escalated to a HardFault when FreeMASTER-JLink connects to the application. Regardless the possible HardFault root cause, let's first make an experiment to confirm that it really occurs.
Please locate your vector table (startup_ARMCM7.c) and implement a two different handlers, one for HardFault and one for DebugMon. Implement each handler as a short endless loop which just increment a global variable (countHardFault, countDebugMon). Add the two counters to FreeMASTER watch to see if they will count (meaning the theory was correct) or not.
Thanks,
Michal
- Mark as New
- Bookmark
- Subscribe
- Mute
- Subscribe to RSS Feed
- Permalink
- Report Inappropriate Content
I load the application to flash, never tried to load to ram.
I didn't run debug session while using the freemaster
- Mark as New
- Bookmark
- Subscribe
- Mute
- Subscribe to RSS Feed
- Permalink
- Report Inappropriate Content
Maybe I have the same problem with you. Have you solved it? If so, can you tell me how it was solved?
- Mark as New
- Bookmark
- Subscribe
- Mute
- Subscribe to RSS Feed
- Permalink
- Report Inappropriate Content
I tried to reproduce your issue, unfortunately, v7.94a was no longer available for download.
I checked latest version (v7.96q), but run into other issues. Eventually, I downgrade to V7.92q and was able to use FreeMASTER with no issue.
Could you check this workaround and let us know if it works for you ?
Kind regards,
Iulian
- Mark as New
- Bookmark
- Subscribe
- Mute
- Subscribe to RSS Feed
- Permalink
- Report Inappropriate Content
Thank you for trying on your side,
But the behavior remain the same after I re-installed to 7.92q
- Mark as New
- Bookmark
- Subscribe
- Mute
- Subscribe to RSS Feed
- Permalink
- Report Inappropriate Content
Just to confirm what toolchain you are using - is it NXP's GCC, IAR, DIAB or GHS ?
- Mark as New
- Bookmark
- Subscribe
- Mute
- Subscribe to RSS Feed
- Permalink
- Report Inappropriate Content
we are using NXP GCC currently.
- Mark as New
- Bookmark
- Subscribe
- Mute
- Subscribe to RSS Feed
- Permalink
- Report Inappropriate Content
Hello,
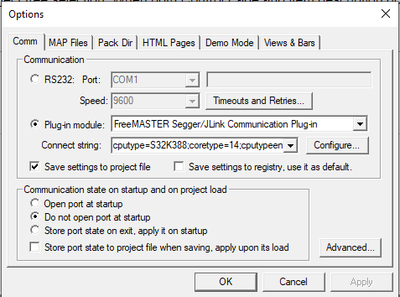
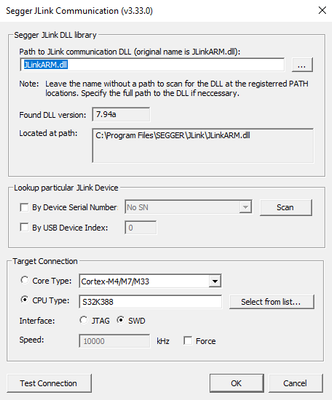
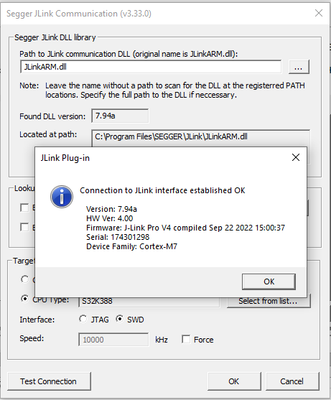
please send a screenshot of your Project Options dialog "Comm" tab (where the plug-in is selected) and send also a screenshot of the JLink plug-in configuration dialog.
Also, please describe your hardware platform (what MCU, board etc.).
Thank you,
Michal
- Mark as New
- Bookmark
- Subscribe
- Mute
- Subscribe to RSS Feed
- Permalink
- Report Inappropriate Content
Hi Michal,
I uploaded to the original post, please help to check it. Thanks.
- Mark as New
- Bookmark
- Subscribe
- Mute
- Subscribe to RSS Feed
- Permalink
- Report Inappropriate Content
Thank you,
the error code 0x80000081 is not applicable here, this is just an intermediate error returned for old protocol command probed by FreeMASTER for backward compatibility. The overall result is OK (0x0), which means the JLink plug-in "thinks" it is returning a valid data.
We will need to do some experiments to find out what is wrong. I suspect the FreeMASTER reads the correct memory, but the CPU is halted. Is there any other way how you can find out if the application is running (e.g. any LED blinking)? It sometimes happens that during JTAG connect/disconnect process, the core gets reset and/or halted.
Please do these experiments:
- Make your FreeMASTER variable modifiable and change it from variable watch grid to some other value. Will it work? If my theory is correct, the variable will change, but will remain constant after that.
- If you use IAR toolchain, please attach the debugger and see if you will be able to pause/resume application execution. FYI: the IAR debugger session shall be able to share the JLink connection with FreeMASTER.
- If IAR is attached, press the software reset button.
Similar to IAR, you can also use Segger Ozone debugger. This is also able to co-exist with FreeMASTER on the same JLink connection.
I will ask my colleagues to replicate the same HW setup and to try to replicate the issue locally.
Thanks,
Michal
- Mark as New
- Bookmark
- Subscribe
- Mute
- Subscribe to RSS Feed
- Permalink
- Report Inappropriate Content
Hi Michal,
Thanks for the advice.
I just confirmed, when power-on the MCU and its SW running OK.
the mcu halt when I click on the Go button in freemaster. do you have any idea why the freemaster halt the mcu execution?
