- Forums
- Product Forums
- General Purpose MicrocontrollersGeneral Purpose Microcontrollers
- i.MX Forumsi.MX Forums
- QorIQ Processing PlatformsQorIQ Processing Platforms
- Identification and SecurityIdentification and Security
- Power ManagementPower Management
- Wireless ConnectivityWireless Connectivity
- RFID / NFCRFID / NFC
- Advanced AnalogAdvanced Analog
- MCX Microcontrollers
- S32G
- S32K
- S32V
- MPC5xxx
- Other NXP Products
- S12 / MagniV Microcontrollers
- Powertrain and Electrification Analog Drivers
- Sensors
- Vybrid Processors
- Digital Signal Controllers
- 8-bit Microcontrollers
- ColdFire/68K Microcontrollers and Processors
- PowerQUICC Processors
- OSBDM and TBDML
- S32M
-
- Solution Forums
- Software Forums
- MCUXpresso Software and ToolsMCUXpresso Software and Tools
- CodeWarriorCodeWarrior
- MQX Software SolutionsMQX Software Solutions
- Model-Based Design Toolbox (MBDT)Model-Based Design Toolbox (MBDT)
- FreeMASTER
- eIQ Machine Learning Software
- Embedded Software and Tools Clinic
- S32 SDK
- S32 Design Studio
- GUI Guider
- Zephyr Project
- Voice Technology
- Application Software Packs
- Secure Provisioning SDK (SPSDK)
- Processor Expert Software
-
- Cloud Lab Forums
- Topics
- Mobile Robotics - Drones and RoversMobile Robotics - Drones and Rovers
- NXP Training ContentNXP Training Content
- University ProgramsUniversity Programs
- Rapid IoT
- NXP Designs
- SafeAssure-Community
- OSS Security & Maintenance
- Using Our Community
-
-
- Knowledge Bases
- ARM Microcontrollers
- Identification and Security
- i.MX Processors
- Model-Based Design Toolbox (MBDT)
- QorIQ Processing Platforms
- S32 Automotive Processing Platform
- CodeWarrior
- Wireless Connectivity
- MCUXpresso Suite of Software and Tools
- MQX Software Solutions
- RFID / NFC
- Advanced Analog
-
- Home
- :
- MQX Software Solutions
- :
- Essentials of MQX RTOS Application Development Course - Lab Guides Knowledge Base
- :
- Session 20: Task Aware Debugging
Session 20: Task Aware Debugging
- Subscribe to RSS Feed
- Mark as New
- Mark as Read
- Bookmark
- Subscribe
- Printer Friendly Page
- Report Inappropriate Content
Session 20: Task Aware Debugging
Session 20: Task Aware Debugging
This video presentation is the twentieth installment of the Essentials of MQX RTOS Application Development training course. In this session, you will be introduced to Task Aware Debugging.
This training was created by Embedded Access Inc., a Freescale sponsored training provider and proven partner.
| Session 19 Course Line | Lab Outline |
|---|---|
|
|
First, watch the video for Session 20: Task Aware Debugging.
Then, follow through with the interactive lab assignment below.
SESSION 20: LAB ASSIGNMENT
INTRODUCTION
Task Aware Debugging (TAD) is a very powerful feature for gaining insight into the inner workings of your application. In many cases it is not practical, or too time consuming, to use a conventional method such as print statements to the console in order to efficiently debug your application. As you saw in the video, you can use TAD to obtain information about all of the kernel objects, stacks, interrupts, and the status of your tasks. You will now see in the lab how TAD can be used to debug a sequence of events bug that is in the application.
OBJECTIVE
The objective of this lab is to gain experience using the Task Aware Debugging (TAD) feature and to learn how it can be used to debug an application.
ASSIGNMENT
RUNNING THE APPLICATION
- Open your completed lab 19, or use the provided code with Lab 19 completed.
- Compile and download the code, and let it run for a few seconds.
- Click on the 'suspend' icon to pause the execution. Do not kill the application with the Terminate icon (which is a red square).
LOOKING AT TASK WINDOWS
- Click on the MQX pull down menu and select the Task Summary from the MQX pull down menu. The task summary list should appear. Confirm that the tasks listed by name is the correct set of tasks for your project, check that the priorities are correct, note the various states that the tasks are in, and observe if any of the tasks have an error.
Note that the Health Task has an error "MSGQ: Queue is not Open." This will be investigated later in the lab. - Open the 'Ready Queue' window and confirm that the Active Task is listed at the top of the Ready Queue, and that any other tasks you saw in the Task Summary window with a status of 'Ready' show up below the Active Task in the Ready Queue window. You may only see one application task in this queue (along with MQX's Idle Task), or there ma be other tasks listed, it all depends on what the status was when you paused execution of the application.
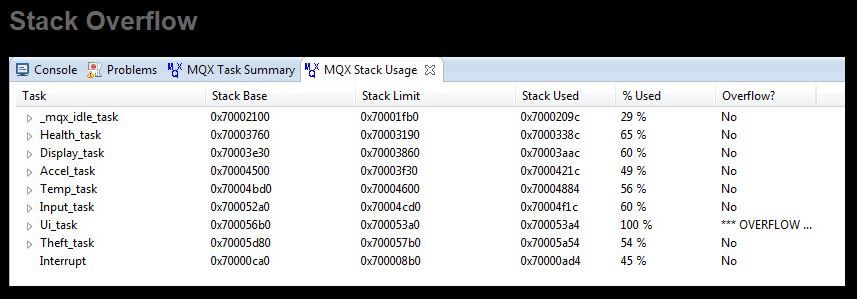
- Open the 'Stack Usage' window and observe if there has been an overflow or if any tasks have come close to overflowing their stack.
CREATING A NEW ERROR CODE
- Stop execution of the application and open main.h. Create a define for a new error code that will be used when the application has run out of memory and cannot log more data. The define should use a name such as 'USER_ERROR_LOG_OVERFLOW', and the value that you give this define should not conflict with existing defines for error codes. This can be achieve by putting your error codes at 0xffff0001 and above.
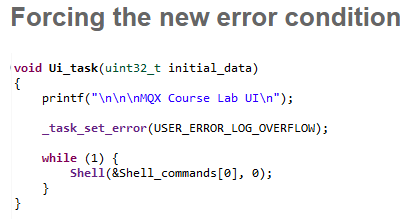
- In order to quickly observe that TAD will acknowledge this new error, open Uitask.c and force this error condition using the _task_set_error() function before the while(1) loop.
- Compile and run the application code for a few seconds. Pause the application and observe that the Ui_task has an 'Unknown error (0xffff0001)' listed in the 'Task Error Code' column of the 'Task Summary' window.
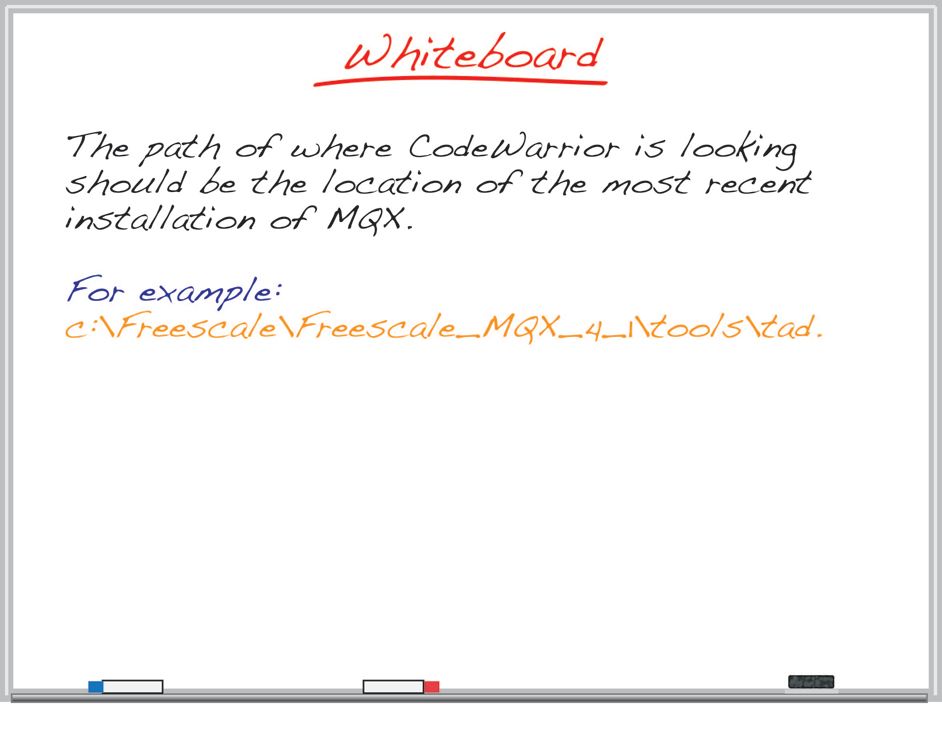
- To make this more meaningful though, it would be helpful if the error code had a custom name instead of 'Unknown error'. In order to find out what path TAD is using to get the error code information from, open the 'Check for Errors' window and expand the 'Show MQX TAD Diagnostics' listing. Look for the entry called 'Tad Path' to see where the TAD information is being retrieved from.
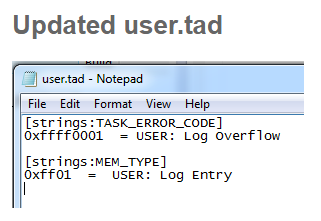
- Open this location in Explorer and create a new text file called 'user.tad' in this folder. Open the new file for editing and enter a title at the top that indicates that this file is an extension of the error codes and then enter the new error code with its definition.
[strings:TASK_ERROR_CODE]
0xffff0001  = USER: Log Overflow
- Save the new file, terminate the application (if it is still being paused), compile, and then run the application for a short period. Now observe the 'Task Summary' window to ensure that the new error code shows up for the Ui_task.
CREATING A STACK OVERFLOW
- Open the 'Stack Usage' window and observe the amount of the stack that has been used for the Ui Task under the '% Used' column.
- Open main.c and in the Task Template List change the amount of stack space allocated for the Ui Task to be just slightly under the amount being used. For example, if 54% of the stack was being used previously (which is 810 bytes of the 1,500 bytes allocated), then set the stack size in the Task Template List to be 800 bytes. Note that if you reduce the stack size too much there will likely be a crash of the application due to corruption of the memory that the stack for the Ui Task is overwriting.
- Terminate, compile, and briefly run the application. Ensure that an overflow is indicated for the Ui Task on the 'Stack Usage' window.
- Restore the stack size of the Ui Task to 1,500 and remove the _task_set_error() function from the Ui Task code.
CREATING A MEMORY ALLOCATION TYPE CODE
- Open the 'user.tad' file that was created in step 11 and add an extension to the memory string types listing to include one for Log Entries. Note that memory type values are 16 bit, not 32 bit. To avoid a conflict with currently defined memory types, start with a value of 0xff01 or higher.
[strings:MEM_TYPE]
0xff01  =  USER: Log Entry
- In main.h create a define called 'USER_MEM_LOG_ENTRY' that is assigned the value used in user.tad (ie 0xff01).
- Open the code for the Health Task and locate the _mem_alloc_system_zero() function call that is used to allocate memory for a new log (when processing messages of type 'LOG_TICK_MESSAGE'). If memory was successfully allocated, set its type to 'USER_MEM_LOG_ENTRY' using the _mem_set_type() function.
- In the initialization section of the Health Task use the same code for setting the memory type after the memory for first health record is allocated.
- Compile and briefly run the code. Open up the 'Memory Block' TAD window and at the very bottom you should find at least one memory block of type 'User Log Entry'. There will be one entry for each health record created and a new entry is created each second.
- If you continue running the application and let it go for a longer period of time you should see a larger list of memory blocks of type 'User Log Entry' in the 'Memory Block' window.
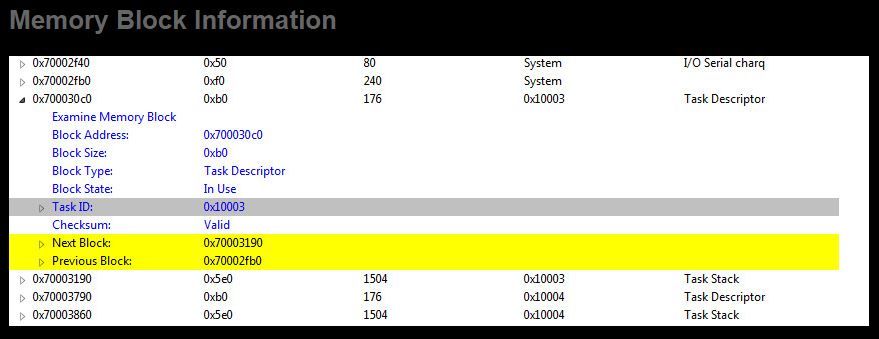
- Note that memory blocks can be expanded to get some additional information. Click on the '+' icon to the left of the address column for memory blocks of different types, as designated in the 'Type' Column. Part of what is shown is the block type, and if this block type references a TAD component, you can get further information on that component. For example expand a Message Pool Summary or Task Descriptor memory block.
- Open the 'Check for Errors' window. You should not see a Memory Manager error since the stack overflow issue has been corrected.
OBSERVING MESSAGE QUEUES
- In the Health Task, when a message of type 'LOG_TICK_MESSAGE' is received memory is allocated for a new health record and then frees up the incoming message. Comment out the '_msg_free(msg);' line at the end of the processing of the message type.
- Compile and then run the code for about 5 seconds.
- Open the 'Task Summary' window and confirm that none of the tasks have an error condition (other than the Health Task which we'll debug shortly).
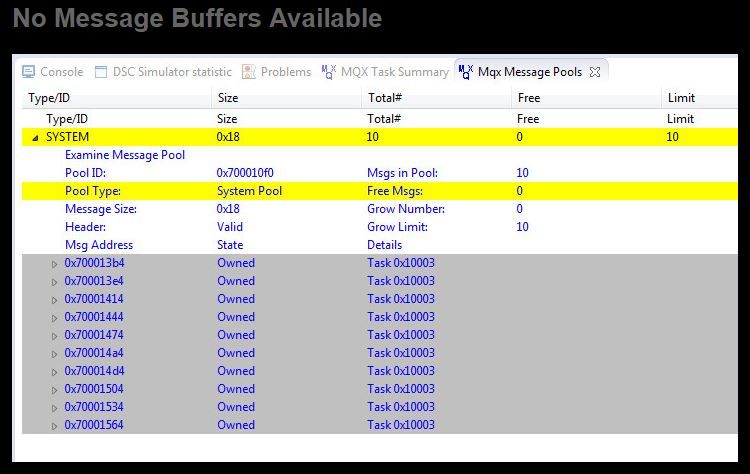
- Open the 'Message Pools' window. Click on the '+' to expand the details for the System Pool. Since the Health Task is not freeing up the message buffers when the tick messages are received, you should notice that the first group of buffers in the pool are 'Owned' and towards the bottom of the pool they are 'Free'.
- Run the application for a little while longer and then observe the System Pool. You should see that all of the buffers now are 'Owned'.
- Add the '_msg_free(msg)' function back into the code for the Health Task (it was commented out in step 25).
DEBUGGING WITH THE KERNEL LOG
- In this section we'll use the Kernel Log feature in TAD to debug the scenario that was discussed towards the end of the video. Specifically we saw in the 'Task Summary' window that for the Health_Task, in the 'Task Error Code' column it said that there was a 'MSGQ: Queue is not Open' error. As you would imagine, this error is generated when a task wants to access a message queue but it hasn't been previously opened.
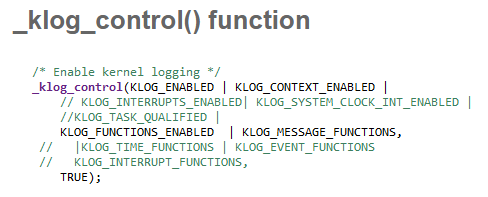
- However, before you can begin using the kernel log, you need to ensure that it is enabled and that the right information is being logged. Kernel Logging is enabled and set up at the top of the init section of the Health Task and the information to be logged is managed using the _klog_control() function. If you haven't touched this code since we added logging in session 10 there will be a variety of information set up to be logged, and with multiple types of log entries it can be harder to debug a specific issue. Our problem appears to be related to Message Passing, so we will need this information stored in the log and it is generally helpful to include context switch information to be able to track which task is active. In order to see the logs associated with message passing 'KLOG_MESSAGE_FUNCTIONS' will need to be included in the list, and 'KLOG_CONTEXT_ENABLED' will turn on logging for context switching. All of the other log types can be deleted from the _klog_control() function, or at least commented out for now.
- To ensure that the log won't run out of memory increase the memory allocated to the log to something like 64K bytes. This can be done when the kernel log is created using the _klog_create() function. It should look something like this:
_klog_create(64*1024, 0);
- Compile and run the application for a few seconds, and in the Task Summary window confirm that the 'MSGQ: Queue is not Open' error condition for the Health Task is still present.
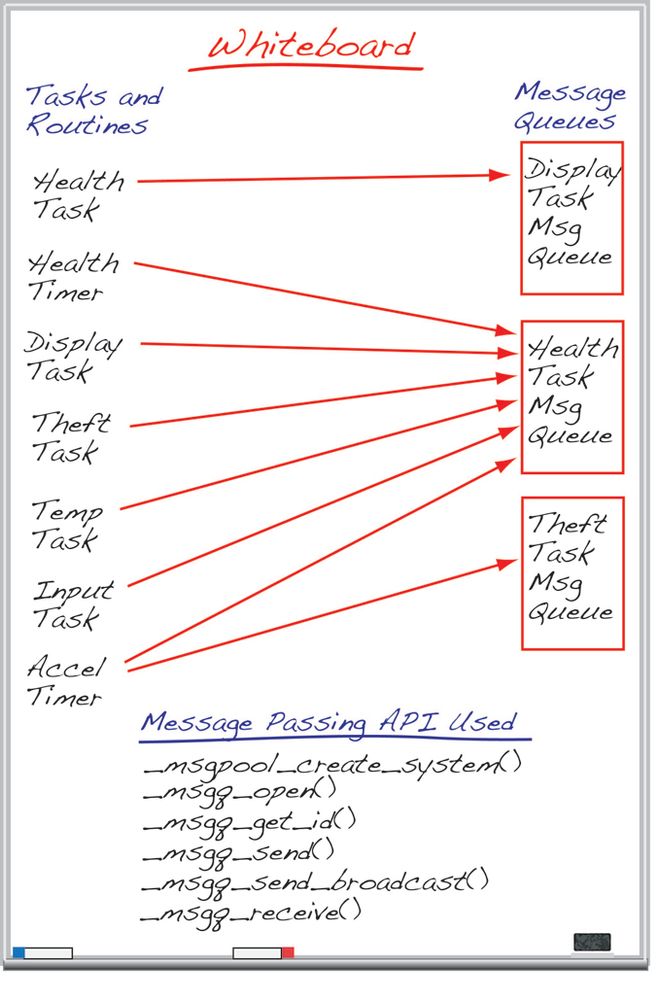
- Your job now is simply to figure out what the problem is that has caused the 'Queue not Open' error to occur. Yes, this is always much easier to say than to do, but a methodical approach of how your system runs and the order that things should be done in is generally a sound practice. The debugging process was started in the video and really you just need to continue along this trail, though perhaps not in so much detail. The whiteboard pop up below gives you a diagram that defines which tasks send messages to each of the message queues. It also lists the Message Passing API calls that are used in our application to help you identify what could be wrong or missing. The remaining steps of this lab will guide you through this thought process, and eventually it gives you the answer, but you are encouraged to at least make an attempt at this. Think about how you'd go about debugging this scenario if it were your own application and you had to solve this before you could progress with your development.
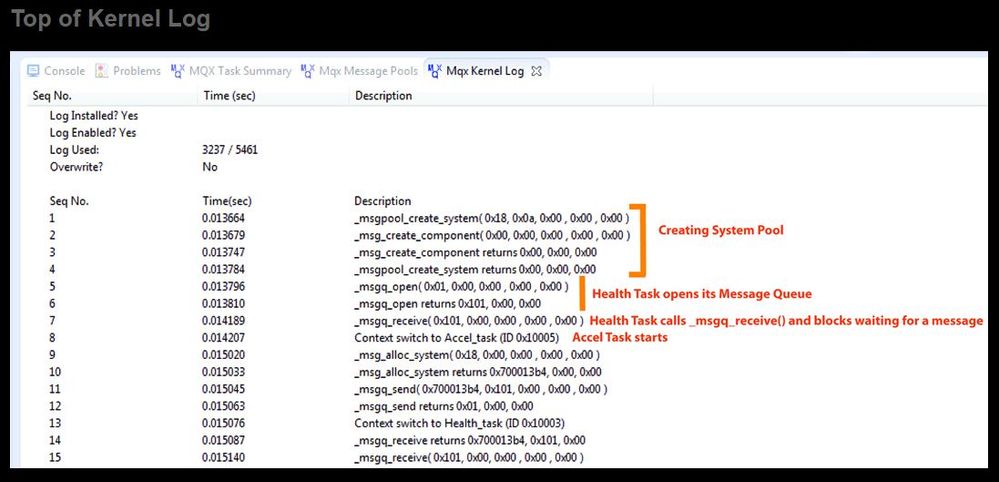
- Open the 'Kernel Log' window. As mentioned in the video, the Health Task would have started running first as it was the highest priority autostart task in the application. You should see in the log that the first thing done is to create the message pool. After that the Health Task's message queue was open, and then the _msgq_receive() function was called so the Health Task will block waiting for a message to come in.
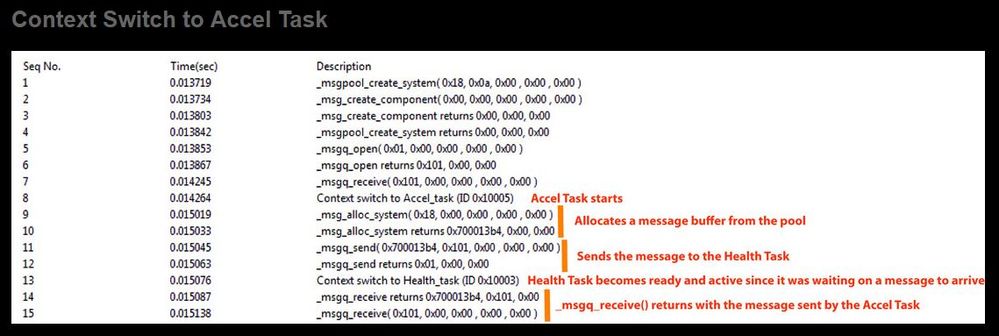
- The Accel task starts to run (context switch to Accel Task), it allocates a message buffer, and then it sends its message to the Health Task. Since the Health Task was currently blocked waiting for a message to arrive in its queue it will become ready to run and, since it is the highest priority task, it then immediately become the active task (context switch to Health Task).
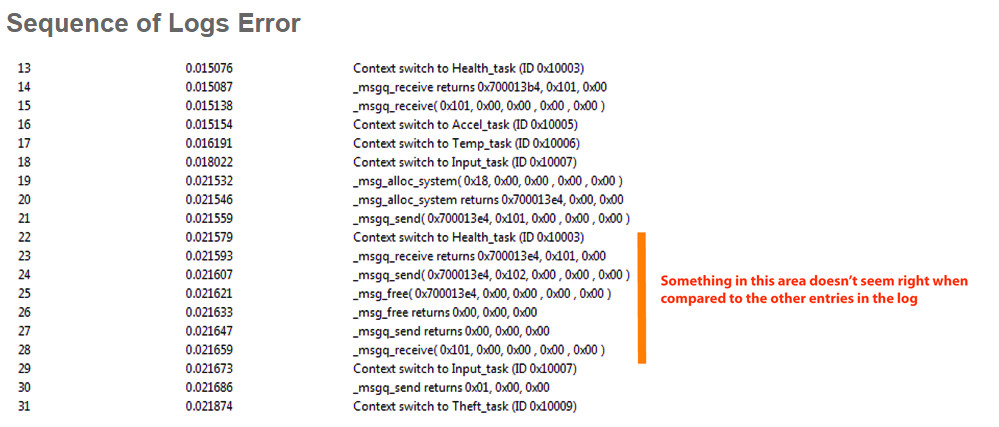
- You should see some context switches; (Accel Task, Temp Task, and Input Task). The Input Task allocates a message buffer, sends the message to the Health Task, and the Health Task immediately becomes active to read its message. So far so good - this all looks normal.
- By now you are getting a sense for the message passing interaction. Look a bit further down in your log and look for a sequence of logs relating to sending and receiving messages that doesn't make sense. The cheat pop up below will identify the area that is suspect. Look for yourself though before opening the cheat or reading further.
- In the sequence of logs identified, the Health Task is trying to send a message to a message queue but it cannot reach that queue. Since the message cannot be sent the message buffer is freed up. This is where the error we saw in the Task Summary Window is recorded. So why would you think that the receiving queue is not reachable, and what can be done about it?
- Answer: See the Cheat above for the reason why this is happening. One way to prevent it from happening is to have the Display Task send a message to the Health Task when it starts up to announce that it is up and running. Also, the Health Task shouldn't send any messages to the Display Task until it is confirmed to be running. The completed source code has this solution implemented so you can reference the relevant areas of the Health Task and the Display Task.
Need more help? The full source code for this lab can be found in the 'Lab Source Code' folder here.


