- NXP Forums
- Product Forums
- General Purpose MicrocontrollersGeneral Purpose Microcontrollers
- i.MX Forumsi.MX Forums
- QorIQ Processing PlatformsQorIQ Processing Platforms
- Identification and SecurityIdentification and Security
- Power ManagementPower Management
- MCX Microcontrollers
- S32G
- S32K
- S32V
- MPC5xxx
- Other NXP Products
- Wireless Connectivity
- S12 / MagniV Microcontrollers
- Powertrain and Electrification Analog Drivers
- Sensors
- Vybrid Processors
- Digital Signal Controllers
- 8-bit Microcontrollers
- ColdFire/68K Microcontrollers and Processors
- PowerQUICC Processors
- OSBDM and TBDML
-
- Solution Forums
- Software Forums
- MCUXpresso Software and ToolsMCUXpresso Software and Tools
- CodeWarriorCodeWarrior
- MQX Software SolutionsMQX Software Solutions
- Model-Based Design Toolbox (MBDT)Model-Based Design Toolbox (MBDT)
- FreeMASTER
- eIQ Machine Learning Software
- Embedded Software and Tools Clinic
- S32 SDK
- S32 Design Studio
- Vigiles
- GUI Guider
- Zephyr Project
- Voice Technology
- Application Software Packs
- Secure Provisioning SDK (SPSDK)
- Processor Expert Software
-
- Topics
- Mobile Robotics - Drones and RoversMobile Robotics - Drones and Rovers
- NXP Training ContentNXP Training Content
- University ProgramsUniversity Programs
- Rapid IoT
- NXP Designs
- SafeAssure-Community
- OSS Security & Maintenance
- Using Our Community
-
-
- Home
- :
- i.MX Forums
- :
- i.MX RT
- :
- RT600 hifi dsp debug downloading is toooooo slow
RT600 hifi dsp debug downloading is toooooo slow
- Subscribe to RSS Feed
- Mark Topic as New
- Mark Topic as Read
- Float this Topic for Current User
- Bookmark
- Subscribe
- Mute
- Printer Friendly Page
RT600 hifi dsp debug downloading is toooooo slow
- Mark as New
- Bookmark
- Subscribe
- Mute
- Subscribe to RSS Feed
- Permalink
- Report Inappropriate Content
Developing environment: evkmimxrt685, McuXpresso11.1.1, XtensaXplorer 8.0.10.3, EVK onboard debugger is programmed to JLINK (as starting up guide doc says), Xtensa OCD Daemon 14.01 is used.
Just open the mu_interrupt demo program in both MCU side and DSP side. Build and download, on my win7 computer, DSP downloading (in XtensaXplorer) takes 45 seconds. Single line stepping is also very slow. I probled the SWD debugging port signals, it's just sending 4 bytes every 1ms. This means 95% of the time, the SWD port is not doing anything. Then I tired on a win10 computer, it gets quicker. Probing the SWD lines again, I can see it's sending 4 bytes every 0.3ms. Still 70% of the time, SWD is not sending anything.
How to speed up the SWD port? Can Xtensa OCD Daemon be configured in some way to accelarate?
Downloading a DSP program with 10~40 seconds, and each single line stepping takes 2~5 seconds --- nobody has the time to debug it.
Really appriciate if someone could help!
- Mark as New
- Bookmark
- Subscribe
- Mute
- Subscribe to RSS Feed
- Permalink
- Report Inappropriate Content
Hello,
I made some tests and I was unable to reproduce the behavior that you mentioned. Downloading and debugging the code on Xtensa doesn't take 45 seconds, also the behavior on the Single-line stepping is normal. My test environment was the following:
- MCUXpresso IDE: 11.1.1
- SDK: 2.7.0
- Xtensa: 8.0.10.3
- Xtensa OCD Daemon: 14.0.1
- JLink: 6.72a
Regards,
Victor
- Mark as New
- Bookmark
- Subscribe
- Mute
- Subscribe to RSS Feed
- Permalink
- Report Inappropriate Content
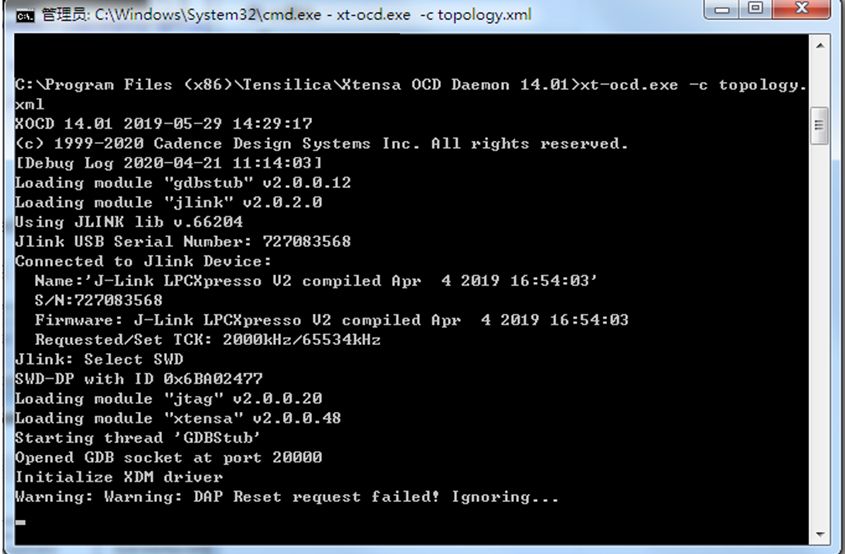
My on board debugger was programmed to Jlink by LPCScrypt_2.1.1_15.exe, as instructed by the "getting start" doc. After running OCD, it shows: Jlink Lib V.66204
Where does your Jlink 6.72a come from? Maybe I should find Jlink 6.72a?
- Mark as New
- Bookmark
- Subscribe
- Mute
- Subscribe to RSS Feed
- Permalink
- Report Inappropriate Content
Hello,
Please download and install the latest version available of the JLink software from the following link: https://www.segger.com/downloads/jlink/#J-LinkSoftwareAndDocumentationPack.
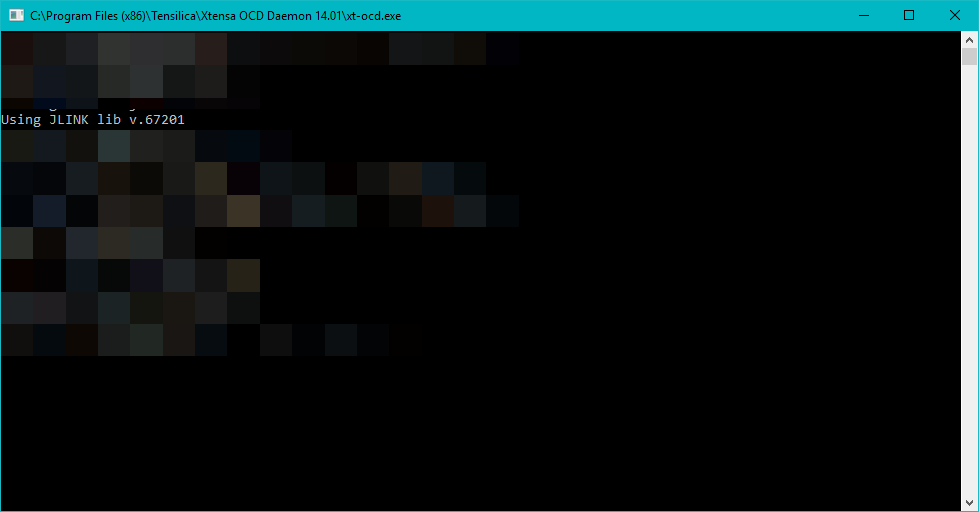
After installing the newest version, when you run the OCD you will see something like the following:
Please let me know your results once you try this.
Regards,
Victor
- Mark as New
- Bookmark
- Subscribe
- Mute
- Subscribe to RSS Feed
- Permalink
- Report Inappropriate Content
Hello Victor, thanks for your help. I downloaded the latest Jlink software, and now I have JLINK lib V.67202 activated. But this doesn't help me. I am still having 40 seconds downloading mu-interrupt demo on win7, and 11 seconds downloading mu-interrupt demo on win10.
stepping signle line over is still slow. (1~5 srconds).
- Mark as New
- Bookmark
- Subscribe
- Mute
- Subscribe to RSS Feed
- Permalink
- Report Inappropriate Content
Hello,
I'm still unable to reproduce this behavior on my end. What version of the SDK are you using? The only difference between your test environment and mine is that I'm running under Windows10, do you have the possibility to test this on a PC running Windows10?
Regards,
Victor
- Mark as New
- Bookmark
- Subscribe
- Mute
- Subscribe to RSS Feed
- Permalink
- Report Inappropriate Content
Yes, I did try in win10. In my previous post, I said: it is 11 seconds downloading mu-interrupt demo on win10. I still believe 11 seconds is too long. Because mu-interrupt is just a very small program. And the stepping line debugging is also too slow in win10.
How many seconds do you need on your win10? (the mu-interrupt example)
- Mark as New
- Bookmark
- Subscribe
- Mute
- Subscribe to RSS Feed
- Permalink
- Report Inappropriate Content
Hello Zhang,
On my Windows10 pc, it takes also around 11 seconds. Keep in mind that when you launch the debug session you are also downloading the binary to the core. On my end, the stepping line debugging speed is normal, the same as in MCUXpresso IDE.
Did you change anything to the debug configurations? Could you please attach some video that shows the behavior when using the stepping line during the debug session?
Regards,
Victor
- Mark as New
- Bookmark
- Subscribe
- Mute
- Subscribe to RSS Feed
- Permalink
- Report Inappropriate Content
Here is the video (sorry for my late reply):
In the video, I was stepping over some lines of writing data to memory, and some lines of doing GPIO with 1us delay. Let's just look at stepping over the line of "*PtrAAA++=10;" , it is almost 1second.
I know, I have the disassembly window open, and the expression watch open. But still, I feel it is way too much slower than what I expect.
If you have used Keil (uVision), you know what a proper stepping over speed is.
And, again, I've used logic analyzer to probe the SWD debugging port lines, for 70% of the total time, SWD has NO data. I would say, the debugging port is only working at 1/3 of the max transfering speed.
I hope this could be optimized.
- Mark as New
- Bookmark
- Subscribe
- Mute
- Subscribe to RSS Feed
- Permalink
- Report Inappropriate Content
Hello Zhang,
Thanks for attaching the video. The speed that you are seeing is normal for the on-board debugger, keep in mind that the onboard debuggers that come with our EVK are not as powerful as an external stand-alone debugger. If you want to increase the download and stepping speed I highly recommend you to get an external Jlink debugger.
Regards,
Victor


