- NXP Forums
- Product Forums
- General Purpose MicrocontrollersGeneral Purpose Microcontrollers
- i.MX Forumsi.MX Forums
- QorIQ Processing PlatformsQorIQ Processing Platforms
- Identification and SecurityIdentification and Security
- Power ManagementPower Management
- MCX Microcontrollers
- S32G
- S32K
- S32V
- MPC5xxx
- Other NXP Products
- Wireless Connectivity
- S12 / MagniV Microcontrollers
- Powertrain and Electrification Analog Drivers
- Sensors
- Vybrid Processors
- Digital Signal Controllers
- 8-bit Microcontrollers
- ColdFire/68K Microcontrollers and Processors
- PowerQUICC Processors
- OSBDM and TBDML
-
- Solution Forums
- Software Forums
- MCUXpresso Software and ToolsMCUXpresso Software and Tools
- CodeWarriorCodeWarrior
- MQX Software SolutionsMQX Software Solutions
- Model-Based Design Toolbox (MBDT)Model-Based Design Toolbox (MBDT)
- FreeMASTER
- eIQ Machine Learning Software
- Embedded Software and Tools Clinic
- S32 SDK
- S32 Design Studio
- Vigiles
- GUI Guider
- Zephyr Project
- Voice Technology
- Application Software Packs
- Secure Provisioning SDK (SPSDK)
- Processor Expert Software
-
- Topics
- Mobile Robotics - Drones and RoversMobile Robotics - Drones and Rovers
- NXP Training ContentNXP Training Content
- University ProgramsUniversity Programs
- Rapid IoT
- NXP Designs
- SafeAssure-Community
- OSS Security & Maintenance
- Using Our Community
-
-
- Home
- :
- MCUXpresso Software and Tools
- :
- MCUXpresso General
- :
- LinkServer Debugging failing in MCUXpressoIDE 10.3.1
LinkServer Debugging failing in MCUXpressoIDE 10.3.1
- Subscribe to RSS Feed
- Mark Topic as New
- Mark Topic as Read
- Float this Topic for Current User
- Bookmark
- Subscribe
- Mute
- Printer Friendly Page
LinkServer Debugging failing in MCUXpressoIDE 10.3.1
- Mark as New
- Bookmark
- Subscribe
- Mute
- Subscribe to RSS Feed
- Permalink
- Report Inappropriate Content
I'm trying to debug a new FRDM K22F board running an unmodified frdmk22f_freertos_generic project from the SDK. However, after building the project without any errors (as far as I can tell), and attempting to debug it using the given frdmk22f_freertos_generic LinkServer Debug.launch, the IDE throws up an error message saying "'Launching frdmk22f_freertos_generic LinkServer Debug' has encountered a problem. Could not determine GDB version using command: arm-none-eabi-gdb --version"
Under details this message is repeated again.
I tried running arm-none-eabi-gdb --version from "Project->Utilities->Open command prompt here" which runs the program without issue, giving correct version information, although it does appear to hang for a bit before giving its output. I wonder if this could be causing the debug launcher to timeout somehow? And if that's the case, how would I circumvent this or disable a timeout? Could something else be causing the problem?
I've already tried restarting the PC running MCUXpressoIDE, and reinstalling the IDE as well, but this issue is persisting.
It also appears that this gdb version check is happening before it flashes the board, since the board is still running its factory RGBLED demo.
- Mark as New
- Bookmark
- Subscribe
- Mute
- Subscribe to RSS Feed
- Permalink
- Report Inappropriate Content
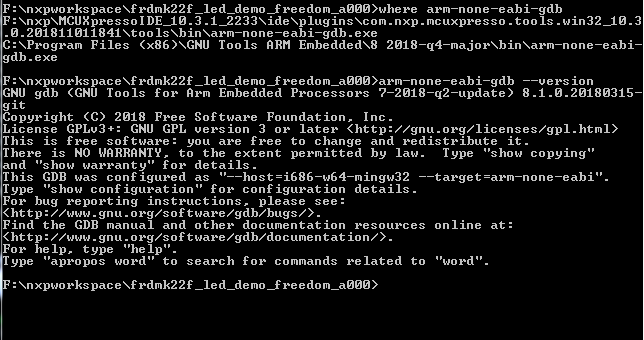
Here's the results of a command prompt spawned from inside MCUXpresso. The PATH picks up 2 different versions of arm-none-eabi-gdb, however the first one it encounters (and the one that gets run) is from the IDE's toolchain. (The other arm-none-eabi-gdb's version is 8.2.50.20181213-git).
- Mark as New
- Bookmark
- Subscribe
- Mute
- Subscribe to RSS Feed
- Permalink
- Report Inappropriate Content
I don’t know if this will help but I found this old FAQ from Code Red (predecessor of mcuxpresso)
- Mark as New
- Bookmark
- Subscribe
- Mute
- Subscribe to RSS Feed
- Permalink
- Report Inappropriate Content
Thanks for the link! After reading it I tried mucking around with the Debug Configuration settings, using default from different places, etc. But to no avail. I think the issue is that, for whatever reason, the MingW-based GDB takes about 16 seconds to start up, and MCUXpresso assumes it's timed out and abort the debugging process. But I can't think of any way around this, and I don't know why gdb/arm-none-eabi-gdb takes so long to start either. If anyone can point me to some way of addressing this I would be incredibly grateful.
- Mark as New
- Bookmark
- Subscribe
- Mute
- Subscribe to RSS Feed
- Permalink
- Report Inappropriate Content
Another thought - if an app is taking a long time to start, this is probably caused by your anti virus software. Look in the AV tool settings to improve this
- Mark as New
- Bookmark
- Subscribe
- Mute
- Subscribe to RSS Feed
- Permalink
- Report Inappropriate Content
The tools supplied in MCUXpressoIDE are definitely NOT based on MinGW - they are completely native executables.
i guess the next question is, which GDB are you running? Do you have another version of the compiler installed on your path?
perhaps you could open a command prompt and show the PATH? You can do this directly in the IDE by Ctrl-click on the project name in the bottom left of th window.
- Mark as New
- Bookmark
- Subscribe
- Mute
- Subscribe to RSS Feed
- Permalink
- Report Inappropriate Content
Hi Thomas,
could you provide a few more details (it sounds you are using the LinkServer connection?) you are using to connect to the board, the logs in the console and the gdb logs (Board Bring-Up Tips, GDB Logs and Traces in Eclipse | MCU on Eclipse )?
I'm not sure any more what default firmware is present on the FRDM-K22F, as I have on my boards either P&E or SEGGER (which both work fine for me).7
Other than that, there could be many reasons for failing a debug connection, starting with using the wrong USB port on the board. There is a list of things to check on Debugging Failure: Check List and Hints | MCU on Eclipse
I hope this helps,
Erich
- Mark as New
- Bookmark
- Subscribe
- Mute
- Subscribe to RSS Feed
- Permalink
- Report Inappropriate Content
Hi Erich,
Sorry for the delay, I was out all of last week. I'll do my best to give you all of the log info I can.
First, I am using the LinkServer connection, I can connect to and program the board without any issue. However, the debug fails before it even attempts to program the board.
Here is the output in the RedlinkServer logs:
[Started server]
[Connected on port 3025]
redlink> ProbeList
Index = 1
Manufacturer = MBED
Description = MBED CMSIS-DAP
Serial Number = 0231020316BB5E55EB47A39C
VID:PID = 0D28:0204
Path = \\?\hid#vid_0d28&pid_0204&mi_03#7&36903039&0&0000#{4d1e55b2-f16f-11cf-88cb-001111000030}
redlink> ProbeStatus
Index = 1
Manufacturer = MBED
Description = MBED CMSIS-DAP
Serial Number = 0231020316BB5E55EB47A39C
VID:PID = 0D28:0204
Path = \\?\hid#vid_0d28&pid_0204&mi_03#7&36903039&0&0000#{4d1e55b2-f16f-11cf-88cb-001111000030}
IsOpen = FALSE
WireInitialized = FALSE
WireProtocol = JTAG
CoresConfigured = FALSE
PacketSize = 64
Reference Count = 0
HasSWV = FALSE
HasETM = FALSE
HasJTAG = TRUE
HasSWD = TRUE
Probe Type = CMSIS-DAP
Probe Reference Count = 0
The gdb logs are never populated with any information. I think the initial version check via "arm-none-eabi-gdb --version" fails so it doesn't even attempt to run gdb normally.
I've double checked that I'm using the correct USB port on the board for debugging. In my current setup, only the k22f is connected to my machine.
I went through the debugging check list and hints, but they all seem to cover issues where the debugger fails after starting, or where the debugger cannot connect to the board. I'm not getting any of these error messages, only the "Could not determine GDB version using command: arm-none-eabi-gdb --version" as before.
- Mark as New
- Bookmark
- Subscribe
- Mute
- Subscribe to RSS Feed
- Permalink
- Report Inappropriate Content
Hello Thomas Hardt,
Please update the on board debug firmware to Jlink or P&E refer to :
OpenSDA Serial and Debug Adapter | NXP
The steps just like below:
1)Press the Reset button (and keep it pressed) while power the board with the OpenSDA USB connector;
2) The board will show up as BOOTLOADER drive on your system:
3) Copy OpenSDA firmware you download to the BOOTLOADER driver:
4) The copy operation takes about 2-3 seconds, after finished , unpower the board.
5) Power the board again normally .
Hope it helps,
Have a great day,
TIC
-------------------------------------------------------------------------------
Note:
- If this post answers your question, please click the "Mark Correct" button. Thank you!
- We are following threads for 7 weeks after the last post, later replies are ignored
Please open a new thread and refer to the closed one, if you have a related question at a later point in time.
-------------------------------------------------------------------------------
- Mark as New
- Bookmark
- Subscribe
- Mute
- Subscribe to RSS Feed
- Permalink
- Report Inappropriate Content
Hi Alice, thanks for your response.
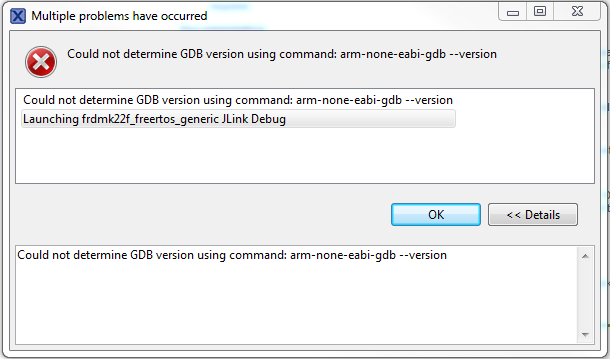
I updated the board's firmware and put the latest JLink SDA firmware on it as well. I have no issues connecting to the board's debug interface, however I'm still getting the same GDB error. In fact it's coming up twice now:
Both errors contain the same description under details. This occurs after starting the debugger, after it hangs for a few seconds on the launch stage titled "Launching: Debugging remote C/C++ application" At this point the progress bar shows 61%.
I also tested this with a FRDM K66F board that I was able to debug before and have run into the same issues. I'm pretty certain, therefore, that it's not a board issue, but with how the GDB toolchain is setup, however I can't think of anything I changed that would have caused that.
- Mark as New
- Bookmark
- Subscribe
- Mute
- Subscribe to RSS Feed
- Permalink
- Report Inappropriate Content
Hi Thomas,
What about the system of your PC?
How bout reinstall it , also debug a simple project without freeRTOS.
Have a great day,
TIC
- Mark as New
- Bookmark
- Subscribe
- Mute
- Subscribe to RSS Feed
- Permalink
- Report Inappropriate Content
I'm running Windows 7, 64-bit. I tried reinstalling the IDE already, but still got the same error. This error persists regardless of which demo project I'm using, freertos-based or otherwise. Even the hello_world demo fails to launch the debugger.
The issue occurs when MCUXpresso tries to run arm-none-eabi-gdb --version to get the gdb version before actually running the debugger. This happens regardless of the project that I'm debugging, or the board that I'm hosting the project on.

