- NXP Forums
- Product Forums
- General Purpose MicrocontrollersGeneral Purpose Microcontrollers
- i.MX Forumsi.MX Forums
- QorIQ Processing PlatformsQorIQ Processing Platforms
- Identification and SecurityIdentification and Security
- Power ManagementPower Management
- MCX Microcontrollers
- S32G
- S32K
- S32V
- MPC5xxx
- Other NXP Products
- Wireless Connectivity
- S12 / MagniV Microcontrollers
- Powertrain and Electrification Analog Drivers
- Sensors
- Vybrid Processors
- Digital Signal Controllers
- 8-bit Microcontrollers
- ColdFire/68K Microcontrollers and Processors
- PowerQUICC Processors
- OSBDM and TBDML
-
- Solution Forums
- Software Forums
- MCUXpresso Software and ToolsMCUXpresso Software and Tools
- CodeWarriorCodeWarrior
- MQX Software SolutionsMQX Software Solutions
- Model-Based Design Toolbox (MBDT)Model-Based Design Toolbox (MBDT)
- FreeMASTER
- eIQ Machine Learning Software
- Embedded Software and Tools Clinic
- S32 SDK
- S32 Design Studio
- Vigiles
- GUI Guider
- Zephyr Project
- Voice Technology
- Application Software Packs
- Secure Provisioning SDK (SPSDK)
- Processor Expert Software
-
- Topics
- Mobile Robotics - Drones and RoversMobile Robotics - Drones and Rovers
- NXP Training ContentNXP Training Content
- University ProgramsUniversity Programs
- Rapid IoT
- NXP Designs
- SafeAssure-Community
- OSS Security & Maintenance
- Using Our Community
-
- Cloud Lab Forums
-
- Home
- :
- MCUXpresso Software and Tools
- :
- MCUXpresso IDE
- :
- Debugger hangs when saving file
Debugger hangs when saving file
- Subscribe to RSS Feed
- Mark Topic as New
- Mark Topic as Read
- Float this Topic for Current User
- Bookmark
- Subscribe
- Mute
- Printer Friendly Page
Debugger hangs when saving file
- Mark as New
- Bookmark
- Subscribe
- Mute
- Subscribe to RSS Feed
- Permalink
- Report Inappropriate Content
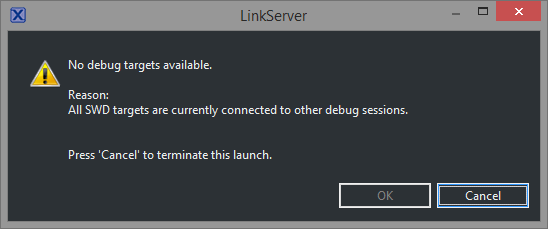
Here's an easy problem to replicate: using an LPC-Link2 in MCUX 10.2.0, launch a debug configuration. While it's running, go back to the Develop perspective. Clean up some comments in a source file while you're waiting, forget you've got the debugger running and reflexively hit 'control-s' to save your work. Sometimes the whole IDE hangs. Sometimes the debugger buttons get grayed out and 'clean up debug' doesn't work, and if you kill gdb from task manager sometimes you can't launch another debug session until restarting:
Killing redlinkserver from the task manager seems to solve that, but I don't know why the 'clean up debug' button doesn't do it.
It doesn't do it every time, but it seems to die with considerable frequency for me.
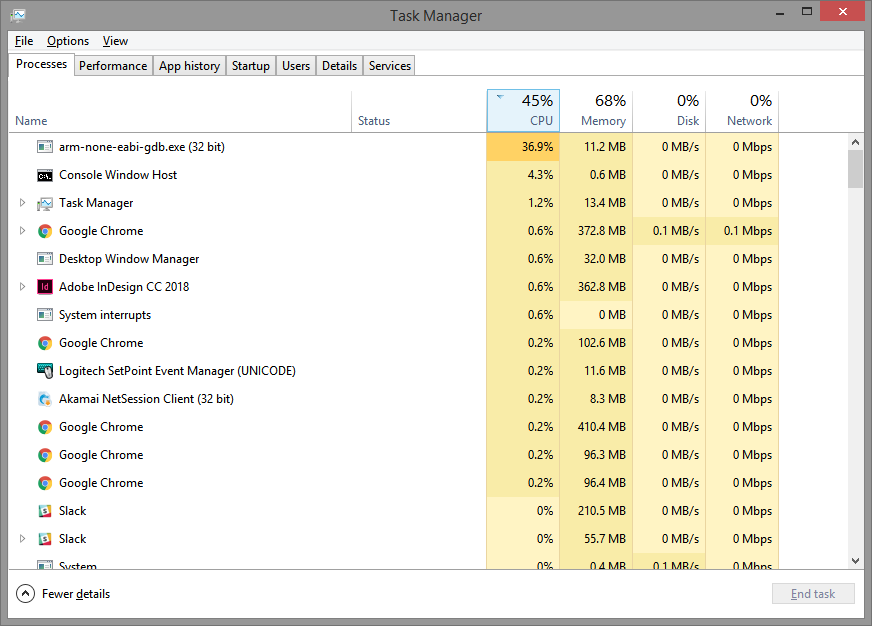
Also, is it normal for gdb to run with > 40% CPU utilization all the time? I'm certain it didn't always do this - my CPU fan increases pitch audibly and at least with the P&E Cyclone I don't normally hear that.
Scott
- Mark as New
- Bookmark
- Subscribe
- Mute
- Subscribe to RSS Feed
- Permalink
- Report Inappropriate Content
Hi SCOTT,
This is an interesting issue. We will investigate improving the interaction of the Debug and Develop perspective in a future release.
With regard to freezing the IDE by saving source code, this has not been duplicated, however, we will continue to explore this possibility and make any necessary fixes reproduced.
Yours,
MCUXpresso IDE Support
- Mark as New
- Bookmark
- Subscribe
- Mute
- Subscribe to RSS Feed
- Permalink
- Report Inappropriate Content
More information for you - I realized it's doing it when there is a breakpoint set in the modified file. If the breakpoint moves, the debugger says "Interrupt command received. Halting execution." And just now when I tried it, I also got "PE-ERROR: ERROR: Could not find thread-id 00000000" after a few seconds, and the target is hung.
- Mark as New
- Bookmark
- Subscribe
- Mute
- Subscribe to RSS Feed
- Permalink
- Report Inappropriate Content
It happened a few times in a row the other day, and now I'm not able to replicate the problem. I'll let you know if I figure out how to replicate it more reliably. My question about gdb stands - is it normal for it to run at such high CPU utilization with the LPC-Link2? This is with the debugger paused, but it doesn't seem to matter:
In contrast, with my Cyclone ACP, the entire system's CPU load is under 10% , and less than 2% of that is MCUX and the debug processes.
Scott

