- NXP Forums
- Product Forums
- General Purpose MicrocontrollersGeneral Purpose Microcontrollers
- i.MX Forumsi.MX Forums
- QorIQ Processing PlatformsQorIQ Processing Platforms
- Identification and SecurityIdentification and Security
- Power ManagementPower Management
- MCX Microcontrollers
- S32G
- S32K
- S32V
- MPC5xxx
- Other NXP Products
- Wireless Connectivity
- S12 / MagniV Microcontrollers
- Powertrain and Electrification Analog Drivers
- Sensors
- Vybrid Processors
- Digital Signal Controllers
- 8-bit Microcontrollers
- ColdFire/68K Microcontrollers and Processors
- PowerQUICC Processors
- OSBDM and TBDML
-
- Solution Forums
- Software Forums
- MCUXpresso Software and ToolsMCUXpresso Software and Tools
- CodeWarriorCodeWarrior
- MQX Software SolutionsMQX Software Solutions
- Model-Based Design Toolbox (MBDT)Model-Based Design Toolbox (MBDT)
- FreeMASTER
- eIQ Machine Learning Software
- Embedded Software and Tools Clinic
- S32 SDK
- S32 Design Studio
- Vigiles
- GUI Guider
- Zephyr Project
- Voice Technology
- Application Software Packs
- Secure Provisioning SDK (SPSDK)
- Processor Expert Software
-
- Topics
- Mobile Robotics - Drones and RoversMobile Robotics - Drones and Rovers
- NXP Training ContentNXP Training Content
- University ProgramsUniversity Programs
- Rapid IoT
- NXP Designs
- SafeAssure-Community
- OSS Security & Maintenance
- Using Our Community
-
-
- Home
- :
- Software Forums
- :
- S32 Design Studio
- :
- How to debug source code with S32DS
How to debug source code with S32DS
- Subscribe to RSS Feed
- Mark Topic as New
- Mark Topic as Read
- Float this Topic for Current User
- Bookmark
- Subscribe
- Mute
- Printer Friendly Page
How to debug source code with S32DS
- Mark as New
- Bookmark
- Subscribe
- Mute
- Subscribe to RSS Feed
- Permalink
- Report Inappropriate Content
Hi,
I want to debug my source code with S32 Design Studio. I already setup a project with my own build configuration using DIAB compiler for MPC5604P. I'm also able to start a debug session with the eval board TRK-MPC5604P and the board does, what I expected. But breakpoints are not reached and when I stop execution I can only see the disassembly and not the C code. I guess it is a missing compiler option or path setting, but I did not find anything what could help. Can you give me some ideas what I could check to be able to debug source code?
Regards, Christian
- Mark as New
- Bookmark
- Subscribe
- Mute
- Subscribe to RSS Feed
- Permalink
- Report Inappropriate Content
Hi,
I'm back from vacation, but problem is the same. I checked the out file - it is ELF format. But even after renaming debugging is not possible with this file. When I choose it and halt the debugger, I see multiple messages "Error : Error in ONCE status register during instruction execution." No disassembly is shown in that case and even the board seems not to be working. With HEX binary the code is executed and on halt the disassembly is shown. So it seems to be a problem with ELF file.
Christian
- Mark as New
- Bookmark
- Subscribe
- Mute
- Subscribe to RSS Feed
- Permalink
- Report Inappropriate Content
I know this is an old question, but I was looking for something else and came across this thread....
>Error : Error in ONCE status register during instruction execution."
This implies the MCU reset prior to when you halted. That's probably not what you intended. Most common cause of that in my experience on a dev board when you're trying to hack something together is attempting to access a peripheral that has not had a clock provided for it.
Good luck.
- Mark as New
- Bookmark
- Subscribe
- Mute
- Subscribe to RSS Feed
- Permalink
- Report Inappropriate Content
The -g option is already set. Is there any further option which has to be set? Does -o define the elf output file?
- Mark as New
- Bookmark
- Subscribe
- Mute
- Subscribe to RSS Feed
- Permalink
- Report Inappropriate Content
the -o option just specify the output name. Please check your .dld file. More details about diab linker file is here:
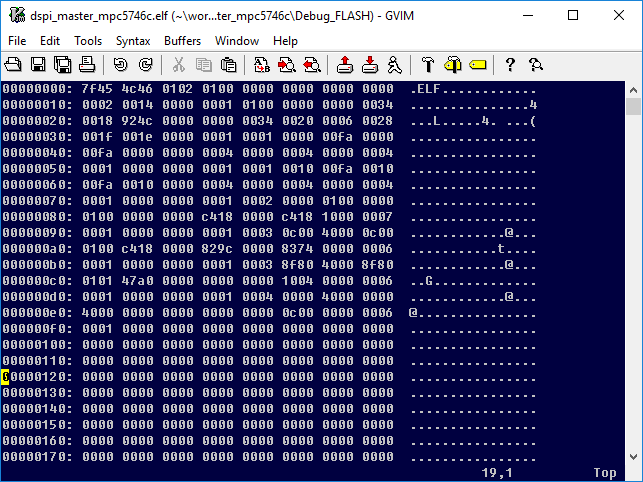
Your .out file is probably .elf file. Just check the file header in some text editor. Should start with .ELF like this one:
You can also try to rename the .out file to .elf file - if it is elf file format.
Jiri
- Mark as New
- Bookmark
- Subscribe
- Mute
- Subscribe to RSS Feed
- Permalink
- Report Inappropriate Content
Ok, I checked my debug settings and recognized that I had chosen the hex output file for debugging. With this file functionality is there, suspend and resume works, but debugging is not possible. But if I'm chosing the out file (two times bigger, with -Xelf option) for debugging, even functionality is not there and resume does not work. I guess it's a format problem. I'm even wondering, that there is no .elf file as I know this from older projects with another tool chain.
I set the -Xelf linker option, so I would expect that output should be in the right format. Is there somebody who is able to successfully debug with GDB and DIAB?
- Mark as New
- Bookmark
- Subscribe
- Mute
- Subscribe to RSS Feed
- Permalink
- Report Inappropriate Content
Hi,
well, for debugging you need to use output with symbols and so on. The .elf with debug info is the right source for debugging. For diab use -g option ( the same as for gcc).
Here is more info about diab compiler/lilnker options:
Jiri
- Mark as New
- Bookmark
- Subscribe
- Mute
- Subscribe to RSS Feed
- Permalink
- Report Inappropriate Content
Hi,
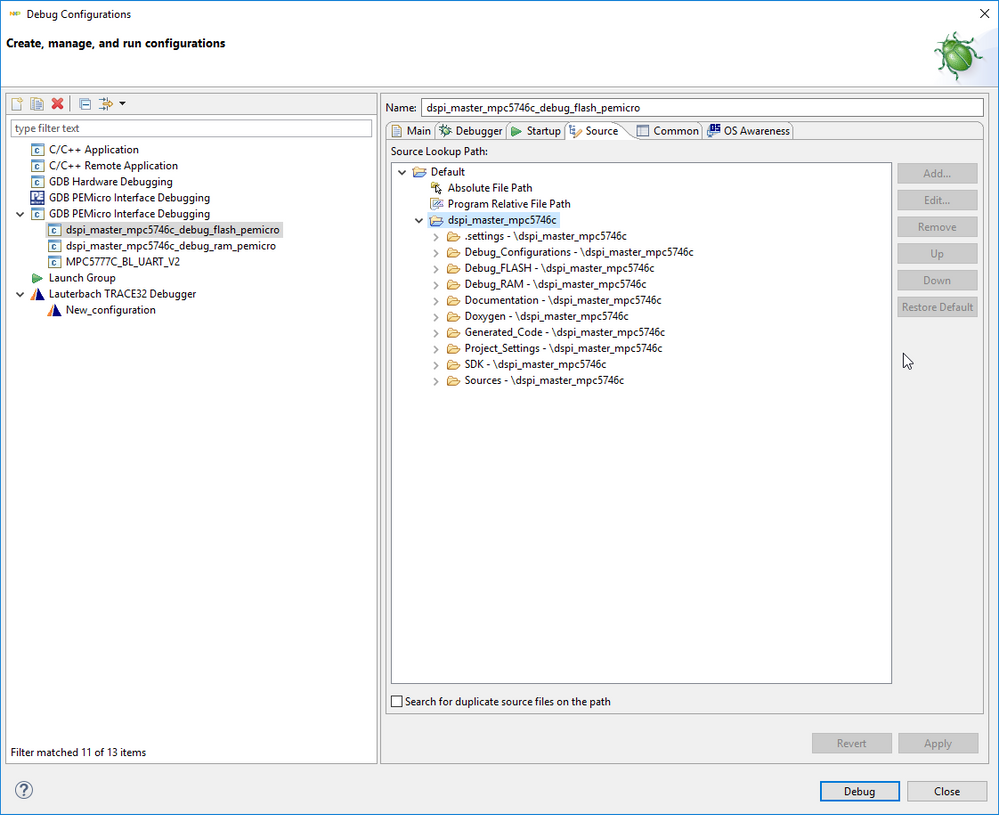
you can specify path to sources in debug session configuration (normally are paths to sources stored in elf file (when compiled with debug flag):
There also may be incompatibility between DIAB elf output and GNU gdb server used in S32DS. So, better place for question related to DIAB and GNU gdb compatibility is Windriver support.
Jiri
- Mark as New
- Bookmark
- Subscribe
- Mute
- Subscribe to RSS Feed
- Permalink
- Report Inappropriate Content
The breakpoint is definitly passed, since a LED is enabled and I set the breakpoint at this position.
I guess the problem is, that the source code is not assigned to the execution address. Maybe any compiler flag is missing to add debug information to binary. Or I'm using the wrong binary fromat. But everything I tried to change had no effect.
- Mark as New
- Bookmark
- Subscribe
- Mute
- Subscribe to RSS Feed
- Permalink
- Report Inappropriate Content
one possible solution is to use h/w breakpoint (assuming the interested module runs from RAM).
Are you sure the break point should be hit (that is placed in the execution path). Try to set breakpoint right after main to verify.
David
- Mark as New
- Bookmark
- Subscribe
- Mute
- Subscribe to RSS Feed
- Permalink
- Report Inappropriate Content
Error : Error in ONCE status register during instruction execution.", i am also suffering on this issue. somebody said it might be the shift freqency problem, it is the communication speed between debugger and software, by default it is 5000khz which might be too high for some chips.
I checked debug configuration, the communication speed is 5000khz, it is gray color , how to change this speed lower ?

