
- NXP Forums
- Product Forums
- General Purpose MicrocontrollersGeneral Purpose Microcontrollers
- i.MX Forumsi.MX Forums
- QorIQ Processing PlatformsQorIQ Processing Platforms
- Identification and SecurityIdentification and Security
- Power ManagementPower Management
- MCX Microcontrollers
- S32G
- S32K
- S32V
- MPC5xxx
- Other NXP Products
- Wireless Connectivity
- S12 / MagniV Microcontrollers
- Powertrain and Electrification Analog Drivers
- Sensors
- Vybrid Processors
- Digital Signal Controllers
- 8-bit Microcontrollers
- ColdFire/68K Microcontrollers and Processors
- PowerQUICC Processors
- OSBDM and TBDML
-
- Solution Forums
- Software Forums
- MCUXpresso Software and ToolsMCUXpresso Software and Tools
- CodeWarriorCodeWarrior
- MQX Software SolutionsMQX Software Solutions
- Model-Based Design Toolbox (MBDT)Model-Based Design Toolbox (MBDT)
- FreeMASTER
- eIQ Machine Learning Software
- Embedded Software and Tools Clinic
- S32 SDK
- S32 Design Studio
- Vigiles
- GUI Guider
- Zephyr Project
- Voice Technology
- Application Software Packs
- Secure Provisioning SDK (SPSDK)
- Processor Expert Software
-
- Topics
- Mobile Robotics - Drones and RoversMobile Robotics - Drones and Rovers
- NXP Training ContentNXP Training Content
- University ProgramsUniversity Programs
- Rapid IoT
- NXP Designs
- SafeAssure-Community
- OSS Security & Maintenance
- Using Our Community
-
-
- Home
- :
- MCUXpresso Software and Tools
- :
- MCUXpresso IDE
- :
- Restore debugger - LPCXpresso824 Max
Restore debugger - LPCXpresso824 Max
- Subscribe to RSS Feed
- Mark Topic as New
- Mark Topic as Read
- Float this Topic for Current User
- Bookmark
- Subscribe
- Mute
- Printer Friendly Page
Restore debugger - LPCXpresso824 Max
- Mark as New
- Bookmark
- Subscribe
- Mute
- Subscribe to RSS Feed
- Permalink
- Report Inappropriate Content
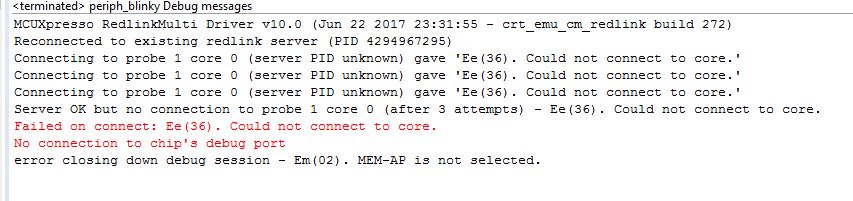
Hello, I've used the debugger many times, but now things have gone wrong such that I'm now getting an error message "Failed on connect: Ee(36). Could not connect to core. No connection to chip's debug port" and then "error closing down debug session - Em(02). MEM-AP is not selected.
Is there a way to restore the factory settings on the debugger?
I've tried:
- updating board firmware
- holding ISP switch down while then pushing the reset button
- holding reset button in while applying power to board
- modifying preferences (uncheck "Pull ISP on reset)
Error messages from MXUXpresso IDE attached.
I'm hoping there might be some magic command to reset things to the original state.
Thanks in advance for your help!
- Mark as New
- Bookmark
- Subscribe
- Mute
- Subscribe to RSS Feed
- Permalink
- Report Inappropriate Content
First of all, please ensure that you have no spurious debug executables running, by killing any processes in your task manager matching:
- redlinkserv
- arm-none-eabi_gdb*
- crt_emu_*
Then delete any .launch files from within your project.
[Note - Do not use the "broken" project for this. Use a "blinky" type project, from, for example, the LPCOpen package for LPC824.]
Now remove your LPCXpresso824-MAX board from your computer.
Check whether you have a jumper fitted on header JP1. If you do, this will disable the built in debug probe (and debug definitely won't work through it!)
Now plug your board into your PC. What do you see in Windows "Devices and Printers" or equivalent?
Now press and hold the ISP button (top right of the board), press and release the Reset button in the bottom left, then release the ISP button.
Now select your project in the IDE's Project Explorer view and click on the "Debug" entry of the QuickStart Panel. Does the IDE detect your board, and if so, what exactly does it display?
Assuming you can see your board in the detection dialog, select it, then continue. Does the debug session start correctly? If not, please post the text from the Debug log (debug messages) and redlinkserv consoles (as per section 14.11 - The Console View - of the MCUXpresso IDE v10.0.2 User Guide).
One thing that do you do need to watch, particularly if you have installed new probe firmware, is that you have the appropriate serial port driver install. Either the mbed serial port driver for the old mbed firmware (there is a link to this on the IDE's Help -> Additional Resources menu), or if you have installed the newest firmware, then the appropriate serial driver for that. For more information on the new firmware, see: New debug probe firmware & drivers for MAX boards
Anyway, let us know how you get on.
Regards,
MCUXpresso IDE Support