
- NXP Forums
- Product Forums
- General Purpose MicrocontrollersGeneral Purpose Microcontrollers
- i.MX Forumsi.MX Forums
- QorIQ Processing PlatformsQorIQ Processing Platforms
- Identification and SecurityIdentification and Security
- Power ManagementPower Management
- MCX Microcontrollers
- S32G
- S32K
- S32V
- MPC5xxx
- Other NXP Products
- Wireless Connectivity
- S12 / MagniV Microcontrollers
- Powertrain and Electrification Analog Drivers
- Sensors
- Vybrid Processors
- Digital Signal Controllers
- 8-bit Microcontrollers
- ColdFire/68K Microcontrollers and Processors
- PowerQUICC Processors
- OSBDM and TBDML
-
- Solution Forums
- Software Forums
- MCUXpresso Software and ToolsMCUXpresso Software and Tools
- CodeWarriorCodeWarrior
- MQX Software SolutionsMQX Software Solutions
- Model-Based Design Toolbox (MBDT)Model-Based Design Toolbox (MBDT)
- FreeMASTER
- eIQ Machine Learning Software
- Embedded Software and Tools Clinic
- S32 SDK
- S32 Design Studio
- Vigiles
- GUI Guider
- Zephyr Project
- Voice Technology
- Application Software Packs
- Secure Provisioning SDK (SPSDK)
- Processor Expert Software
-
- Topics
- Mobile Robotics - Drones and RoversMobile Robotics - Drones and Rovers
- NXP Training ContentNXP Training Content
- University ProgramsUniversity Programs
- Rapid IoT
- NXP Designs
- SafeAssure-Community
- OSS Security & Maintenance
- Using Our Community
-
-
- Home
- :
- MCUXpresso Software and Tools
- :
- Kinetis Design Studio
- :
- Debug and run programs in FRDM-KL82Z
Debug and run programs in FRDM-KL82Z
- Subscribe to RSS Feed
- Mark Topic as New
- Mark Topic as Read
- Float this Topic for Current User
- Bookmark
- Subscribe
- Mute
- Printer Friendly Page
- Mark as New
- Bookmark
- Subscribe
- Mute
- Subscribe to RSS Feed
- Permalink
- Report Inappropriate Content
Hi,
I am having trouble trying to debug and run a program in my FRDM-KL82Z. I have followed all the steps in the guide online:
- Installed the SDK 2.0 with the wizard for the kinetis design studio.
- I have the jlink bootloader loaded in the board.
- I import one of the examples of the SDK ( ../boards\frdmkl82z\demo_apps\bubble\kds )
- I build the project with 0 errors:
Building target: bubble_frdmkl82z.elf
Invoking: Cross ARM C++ Linker
arm-none-eabi-g++ -mcpu=cortex-m0plus -mthumb -mfloat-abi=soft -O0 -fmessage-length=0 -fsigned-char -ffunction-sections -fdata-sections -fno-common -ffreestanding -fno-builtin -Wall -g -T ../settings/MKL82Z128xxx7_flash.ld -Xlinker --gc-sections -Wl,-Map,"bubble_frdmkl82z.map" --specs=nano.specs -mapcs -Xlinker -static -Xlinker -z -Xlinker muldefs -o "bubble_frdmkl82z.elf" -Xlinker --start-group ./utilities/fsl_debug_console.o ./startup/startup_MKL82Z7.o ./startup/system_MKL82Z7.o ./source/bubble.o ./drivers/fsl_clock.o ./drivers/fsl_common.o ./drivers/fsl_flash.o ./drivers/fsl_gpio.o ./drivers/fsl_i2c.o ./drivers/fsl_lpuart.o ./drivers/fsl_smc.o ./drivers/fsl_tpm.o ./board/board.o ./board/clock_config.o ./board/pin_mux.o ./accel/fsl_fxos.o -lm -lg -lgcc -lnosys -Xlinker --end-group
Finished building target: bubble_frdmkl82z.elf12:59:37 Build Finished (took 1s.532ms)
- I launch the debug with the following configuration.

And when the debug perpective open, the program is already running ( I dont have to press startand the program is supposed to start as halted)

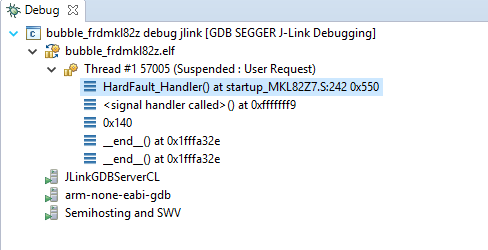
If I pause the program is always in this state:

Any ideas why?
Thank you,
Angel
Solved! Go to Solution.
- Mark as New
- Bookmark
- Subscribe
- Mute
- Subscribe to RSS Feed
- Permalink
- Report Inappropriate Content
Hi!
I have just found a solution. I checked the breakpoint at main and it was already set, I tried switching workspace but the debugger keeps faulting. The solution was to start the debugging: It will start in the same status as stated in the first post (with a hard fault) but, if I press the reset button while in that state, the debug start working as normal. I show it in pictures for anyone that has my same problem.
Start the debugger, here the program seems to be working but it is not. If you pause it, you will see it is in the Hardfault ISR.

Press the reset button of the FRDM-KL82Z: The debugger get into the correct status :smileygrin: :smileygrin: :smileygrin: :smileygrin:

Press play and enjoy :smileyhappy:
I hope this help some other folks around there :smileyhappy:
See you and thank you very much!
Angel
- Mark as New
- Bookmark
- Subscribe
- Mute
- Subscribe to RSS Feed
- Permalink
- Report Inappropriate Content
Hi!
I have just found a solution. I checked the breakpoint at main and it was already set, I tried switching workspace but the debugger keeps faulting. The solution was to start the debugging: It will start in the same status as stated in the first post (with a hard fault) but, if I press the reset button while in that state, the debug start working as normal. I show it in pictures for anyone that has my same problem.
Start the debugger, here the program seems to be working but it is not. If you pause it, you will see it is in the Hardfault ISR.
Press the reset button of the FRDM-KL82Z: The debugger get into the correct status :smileygrin: :smileygrin: :smileygrin: :smileygrin:
Press play and enjoy :smileyhappy:
I hope this help some other folks around there :smileyhappy:
See you and thank you very much!
Angel
- Mark as New
- Bookmark
- Subscribe
- Mute
- Subscribe to RSS Feed
- Permalink
- Report Inappropriate Content
Hello Angel,
- Have you set breakpoint at main :

- Please try to switch another new workspace to have a try, or test another project.

Hope it helps
Have a great day,
TIC
-----------------------------------------------------------------------------------------------------------------------
Note: If this post answers your question, please click the Correct Answer button. Thank you!
-----------------------------------------------------------------------------------------------------------------------
- Mark as New
- Bookmark
- Subscribe
- Mute
- Subscribe to RSS Feed
- Permalink
- Report Inappropriate Content
Ok, I will try this afternoon
However, its weird because yesterday I get it working for a few times. Its like it depends on what I flash before. I was trying using KSDK 1.3, then 2.2, different project settings... The same project sometime works, sometimes it doesn't... Maybe its a problem with the Jlink software? If I flash the same code and run it without debug it works, and I read that in some processors the j-link forget to turn on some clock or something like that... Also this would explain why sometimes it works (if some register is not clear on debug and was previously set correctly may result in the debug working...) I am just throwing some ideas...
Now I am just uploading the code without debug and using printf to debug (old-school debugging).
- Mark as New
- Bookmark
- Subscribe
- Mute
- Subscribe to RSS Feed
- Permalink
- Report Inappropriate Content
Hello Angel,
- If you worry about the project flashed impacting the new project, please
erase the flash use j-link commander (can download at to https://www.segger.com ), and
see the attached video created by my colleague .
- Yes, if download many times, it maybe occur some problem, you can also delete the .metadata folder under
workspace :

BR
Alice