- NXP Forums
- Product Forums
- General Purpose MicrocontrollersGeneral Purpose Microcontrollers
- i.MX Forumsi.MX Forums
- QorIQ Processing PlatformsQorIQ Processing Platforms
- Identification and SecurityIdentification and Security
- Power ManagementPower Management
- MCX Microcontrollers
- S32G
- S32K
- S32V
- MPC5xxx
- Other NXP Products
- Wireless Connectivity
- S12 / MagniV Microcontrollers
- Powertrain and Electrification Analog Drivers
- Sensors
- Vybrid Processors
- Digital Signal Controllers
- 8-bit Microcontrollers
- ColdFire/68K Microcontrollers and Processors
- PowerQUICC Processors
- OSBDM and TBDML
-
- Solution Forums
- Software Forums
- MCUXpresso Software and ToolsMCUXpresso Software and Tools
- CodeWarriorCodeWarrior
- MQX Software SolutionsMQX Software Solutions
- Model-Based Design Toolbox (MBDT)Model-Based Design Toolbox (MBDT)
- FreeMASTER
- eIQ Machine Learning Software
- Embedded Software and Tools Clinic
- S32 SDK
- S32 Design Studio
- Vigiles
- GUI Guider
- Zephyr Project
- Voice Technology
- Application Software Packs
- Secure Provisioning SDK (SPSDK)
- Processor Expert Software
-
- Topics
- Mobile Robotics - Drones and RoversMobile Robotics - Drones and Rovers
- NXP Training ContentNXP Training Content
- University ProgramsUniversity Programs
- Rapid IoT
- NXP Designs
- SafeAssure-Community
- OSS Security & Maintenance
- Using Our Community
-
- Cloud Lab Forums
-
- Home
- :
- MCUXpresso Software and Tools
- :
- MCUXpresso IDE
- :
- frdm-k28 freertos debug tasks not listed in task-list window
frdm-k28 freertos debug tasks not listed in task-list window
- Subscribe to RSS Feed
- Mark Topic as New
- Mark Topic as Read
- Float this Topic for Current User
- Bookmark
- Subscribe
- Mute
- Printer Friendly Page
frdm-k28 freertos debug tasks not listed in task-list window
- Mark as New
- Bookmark
- Subscribe
- Mute
- Subscribe to RSS Feed
- Permalink
- Report Inappropriate Content
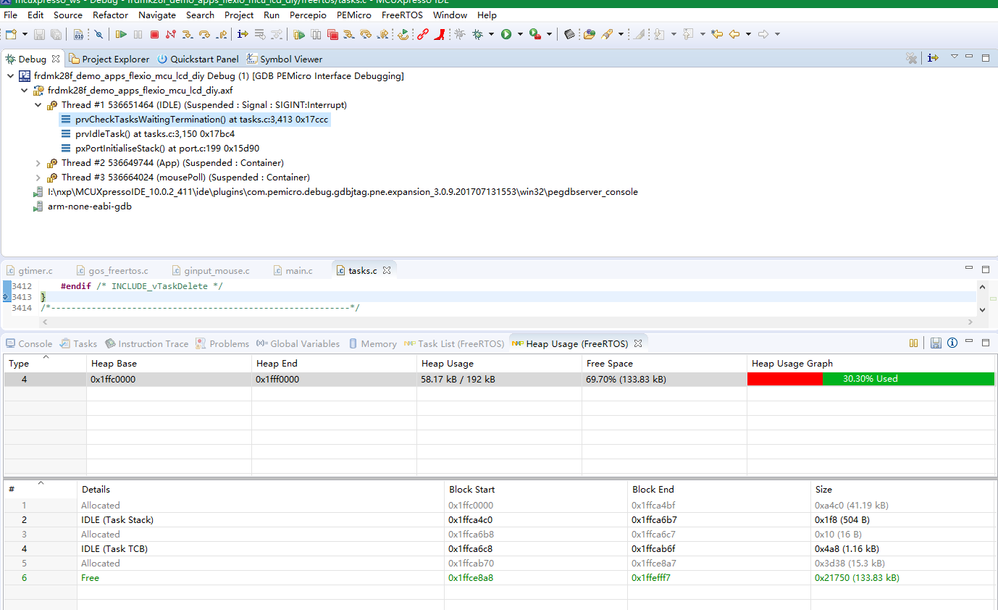
I'm using frdm-k28 and P&E opensda onboard debuger, in a freertos project, the problem is tasks listed in < debug > window, but not listed in <Task List (FreeRTOS)> window. anyone met and fixed this problem ?
The < Heap Usage (FreeRTOS) > window works as blew pic.
- Mark as New
- Bookmark
- Subscribe
- Mute
- Subscribe to RSS Feed
- Permalink
- Report Inappropriate Content
Hi Erich,
In the debug console , there is the message " rtos symbels initilized "
- Mark as New
- Bookmark
- Subscribe
- Mute
- Subscribe to RSS Feed
- Permalink
- Report Inappropriate Content
Hi Kevin,
that message is from the P&E debug connection which properly shows the threads in your screenshot. So P&E is working fine. What somehow does not work is the NXP Thread List in that view.
There are some debug logs of that view present in your workspace.
Can you check (or better: post) the log files present inside your workspace folder? They are located in a folder named FreeRTOS_TAD_logs?
I hope this helps,
Erich
- Mark as New
- Bookmark
- Subscribe
- Mute
- Subscribe to RSS Feed
- Permalink
- Report Inappropriate Content
Hi Erich,
The log message is:
"FreeRTOS Task Aware Debugger for GDB" version 1.0.2 (201704101406)
(c) 2016 NXP Semiconductors, Inc.
==================================
21:32:43.219 INFO: [TadModel] DSF session ID 10 has started.
21:32:46.889 INFO: [TadState] TAD state changed: DEBUG_STARTED -> DEBUG_INIT_0 (SUSPENDED, USER_REQUEST)
21:32:58.251 INFO: [TadState] TAD state changed: DEBUG_INIT_0 -> DEBUG_INIT_1 (RESUMED, USER_REQUEST)
21:32:58.347 INFO: [TadState] TAD state changed: DEBUG_INIT_1 -> DEBUG_SUSPENDED (SUSPENDED, BREAKPOINT)
21:32:59.891 INFO: [TadState] TAD state changed: DEBUG_SUSPENDED -> DEBUG_RESUMED (RESUMED, USER_REQUEST)
08:05:24.530 INFO: [TadModel] DSF session ID 10 has ended.
any help ?
- Mark as New
- Bookmark
- Subscribe
- Mute
- Subscribe to RSS Feed
- Permalink
- Report Inappropriate Content
Ok, that log does not show anything interesting. Are you able to share your project so I can have a look? It might be some optimization settings or some settings, not sure.
Erich
- Mark as New
- Bookmark
- Subscribe
- Mute
- Subscribe to RSS Feed
- Permalink
- Report Inappropriate Content
Hi Kevin,
thank your for that example. With this I can reproduce the problem, investigating it right now.
Erich
- Mark as New
- Bookmark
- Subscribe
- Mute
- Subscribe to RSS Feed
- Permalink
- Report Inappropriate Content
Hi Kevin,
the problem is created by your app task
xTaskCreate(app, "App", 1024 * 20, NULL, uart_task_PRIORITY, NULL);
Above you are creating that task with 80 kByte (!!!) stack. This causes problem in the task view (of course it should not create that issue, so I have reported it to the developer).
If you use 4K (1024) instead of 80KByte, the problem goes away.
Can you give this a try?
Thanks,
Erich
- Mark as New
- Bookmark
- Subscribe
- Mute
- Subscribe to RSS Feed
- Permalink
- Report Inappropriate Content
Hi Erich,
Thanks a lot for your help.
I will give it a try right now.
- Mark as New
- Bookmark
- Subscribe
- Mute
- Subscribe to RSS Feed
- Permalink
- Report Inappropriate Content
Hi Kevin,
can you check what the console view shows (see Troubleshooting Tips for FreeRTOS Thread Aware Debugging in Eclipse | MCU on Eclipse ) ?
Erich

