- NXP Forums
- Product Forums
- General Purpose MicrocontrollersGeneral Purpose Microcontrollers
- i.MX Forumsi.MX Forums
- QorIQ Processing PlatformsQorIQ Processing Platforms
- Identification and SecurityIdentification and Security
- Power ManagementPower Management
- MCX Microcontrollers
- S32G
- S32K
- S32V
- MPC5xxx
- Other NXP Products
- Wireless Connectivity
- S12 / MagniV Microcontrollers
- Powertrain and Electrification Analog Drivers
- Sensors
- Vybrid Processors
- Digital Signal Controllers
- 8-bit Microcontrollers
- ColdFire/68K Microcontrollers and Processors
- PowerQUICC Processors
- OSBDM and TBDML
-
- Solution Forums
- Software Forums
- MCUXpresso Software and ToolsMCUXpresso Software and Tools
- CodeWarriorCodeWarrior
- MQX Software SolutionsMQX Software Solutions
- Model-Based Design Toolbox (MBDT)Model-Based Design Toolbox (MBDT)
- FreeMASTER
- eIQ Machine Learning Software
- Embedded Software and Tools Clinic
- S32 SDK
- S32 Design Studio
- Vigiles
- GUI Guider
- Zephyr Project
- Voice Technology
- Application Software Packs
- Secure Provisioning SDK (SPSDK)
- Processor Expert Software
-
- Topics
- Mobile Robotics - Drones and RoversMobile Robotics - Drones and Rovers
- NXP Training ContentNXP Training Content
- University ProgramsUniversity Programs
- Rapid IoT
- NXP Designs
- SafeAssure-Community
- OSS Security & Maintenance
- Using Our Community
-
-
- Home
- :
- MCUXpresso Software and Tools
- :
- MCUXpresso IDE
- :
- MCUXpresso debug fails to find JLINK
MCUXpresso debug fails to find JLINK
- Subscribe to RSS Feed
- Mark Topic as New
- Mark Topic as Read
- Float this Topic for Current User
- Bookmark
- Subscribe
- Mute
- Printer Friendly Page
MCUXpresso debug fails to find JLINK
- Mark as New
- Bookmark
- Subscribe
- Mute
- Subscribe to RSS Feed
- Permalink
- Report Inappropriate Content
I have a K64F Freedom board and a Segger JLink (Freedom board's onboard debugger is disabled).
In my workspace I have two projects.
First project debugs AOK using JLink (so we know JLink is installed and operating AOK).
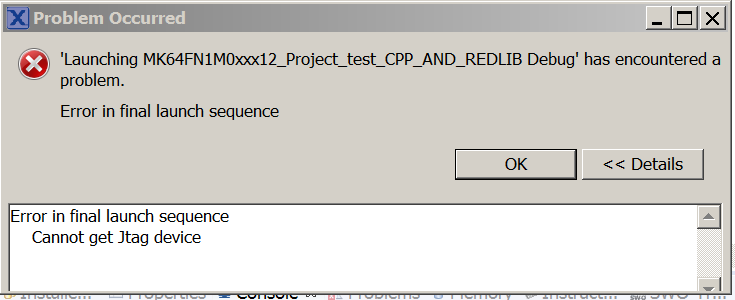
Second project debug fails with the following error dialog:
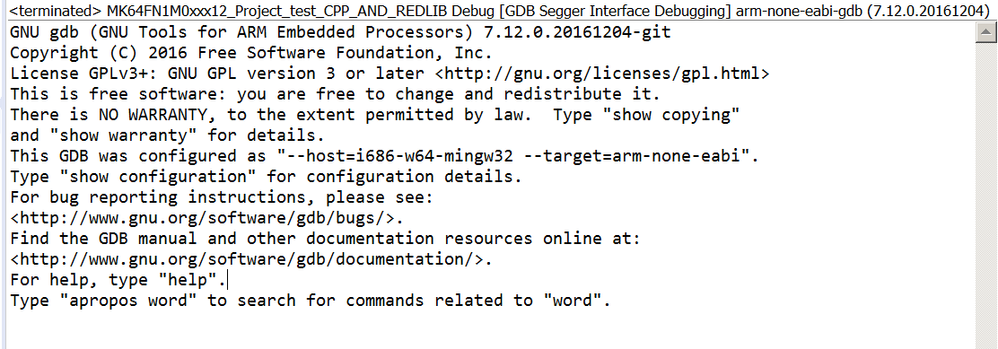
The console window shows:
Why is 2nd project not working with JLink, while first works AOK?
I can't find any difference in the debug launch configuration...
Thanks!
Best Regards, Dave
- Mark as New
- Bookmark
- Subscribe
- Mute
- Subscribe to RSS Feed
- Permalink
- Report Inappropriate Content
Dave,
I am not sure what's the problem with the SW, but I just remembered one of my colleague experienced a SAME problem as yours last month. We tried a lot but he finally solved his connection problem this way. Just for sharing.
1. remove .metadata folder in the current workspace.
2. import a demo project from sdk install folder to test the Jlink connection. OK.
3. import his own project to the IDE then test the connection. Successes!
PS. .metadata folder include workspace setting you customized defined. If you still need it, please replace step1 with "create a empty new workspace for test"
Have a great day,
Jennie Zhang
-----------------------------------------------------------------------------------------------------------------------
Note: If this post answers your question, please click the Correct Answer button. Thank you!
-----------------------------------------------------------------------------------------------------------------------
- Mark as New
- Bookmark
- Subscribe
- Mute
- Subscribe to RSS Feed
- Permalink
- Report Inappropriate Content
Please can you post the gdb traces and the SEGGER log from the Console view? (MUCXpresso IDE v10.0.0 User Guide, section 14.7, "The Console View".
It might be useful to see the ones from the working project and non-working project too (and if you can capture it from the non-working project on the occasion that it actually works).
With regards to Redlib, please see the response in your other thread : https://community.nxp.com/thread/454202
Regards,
MCUXpresso IDE Support
- Mark as New
- Bookmark
- Subscribe
- Mute
- Subscribe to RSS Feed
- Permalink
- Report Inappropriate Content
I regenerated an new SDK packge from the MCUXpresso Config Tools site, removed the previously imported project, reinstalled the SDK and imported the same project, the IDE then test the connection. Successes!
However, I am still unable to determine the cause of the previous connection error, and the parameter Settings of Jlink are the same.
- Mark as New
- Bookmark
- Subscribe
- Mute
- Subscribe to RSS Feed
- Permalink
- Report Inappropriate Content
Hi:
I also made the same mistake on Windows 10 using MCUXpresso IDE v10.0.2 [Build 411] to debug FRDM - KW41Z.
Before this, I can use KDS V3.2 on Windows 10 debug FRDM-KW41Z, even in the macOS Sierra on using the same version of the MCUXpresso can also debug FRDM-KW41Z, but on the Windows 10 MCUXpresso debugging FRDM-KW41Z occurs error :"Cannot get Jtag device"
I saw some people in the community who had the same problem, but didn't give the exact reason and the solution, I tried the various solutions on the website, but none of them.
The following is the console prompt for MCUXpresso debugging:
LinkARM.dll V6.16b (DLL compiled Jun 9 2017 18:03:30)
-----GDB Server start settings-----
GDBInit file: none
GDB Server Listening port: 2331
SWO raw output listening port: 2332
Terminal I/O port: 2333
Accept remote connection: localhost only
Generate logfile: off
Verify download: on
Init regs on start: off
Silent mode: off
Single run mode: on
Target connection timeout: 0 ms
------J-Link related settings------
J-Link Host interface: USB
J-Link script: none
J-Link settings file: none
------Target related settings------
Target device: MKW41Z512xxx4
Target interface: SWD
Target interface speed: auto
Target endian: little
Connecting to J-Link...
$$UserActionStart$$: Terms of use
$$UserActionEnd$$: Terms of use
J-Link is connected.
Device "MKW41Z512XXX4" selected.
Firmware: J-Link OpenSDA 2 compiled May 6 2016 11:04:17
Hardware: V1.00
S/N: 621000000
Checking target voltage...
Target voltage: 3.30 V
Listening on TCP/IP port 2331
Connecting to target...Executing InitTarget()
Found SW-DP with ID 0x0BC11477
Scanning APs, stopping at first AHB-AP found.
AP[0] IDR: 0x04770031 (AHB-AP)
AHB-AP ROM: 0xF0002000 (Base addr. of first ROM table)
CPUID reg: 0x410CC601. Implementer code: 0x41 (ARM)
Found Cortex-M0 r0p1, Little endian.
FPUnit: 2 code (BP) slots and 0 literal slots
CoreSight components:
ROMTbl[0] @ F0002000
ROMTbl[0][0]: F0000000, CID: B105900D, PID: 001BB932 MTB-M0+
ROMTbl[0][1]: F0001000, CID: B105900D, PID: 0008E000 MTBDWT
ROMTbl[0][2]: E00FF000, CID: B105100D, PID: 000BB4C0 ROM Table
ROMTbl[1] @ E00FF000
ROMTbl[1][0]: E000E000, CID: B105E00D, PID: 000BB008 SCS
ROMTbl[1][1]: E0001000, CID: B105E00D, PID: 000BB00A DWT
ROMTbl[1][2]: E0002000, CID: B105E00D, PID: 000BB00B FPB
Executing InitTarget()
Found SW-DP with ID 0x0BC11477
Using pre-configured AP[0] as AHB-AP to communicate with core
AHB-AP ROM: 0xF0002000 (Base addr. of first ROM table)
CPUID reg: 0x410CC601. Implementer code: 0x41 (ARM)
Found Cortex-M0 r0p1, Little endian.
FPUnit: 2 code (BP) slots and 0 literal slots
CoreSight components:
ROMTbl[0] @ F0002000
ROMTbl[0][0]: F0000000, CID: B105900D, PID: 001BB932 MTB-M0+
ROMTbl[0][1]: F0001000, CID: B105900D, PID: 0008E000 MTBDWT
ROMTbl[0][2]: E00FF000, CID: B105100D, PID: 000BB4C0 ROM Table
ROMTbl[1] @ E00FF000
ROMTbl[1][0]: E000E000, CID: B105E00D, PID: 000BB008 SCS
ROMTbl[1][1]: E0001000, CID: B105E00D, PID: 000BB00A DWT
ROMTbl[1][2]: E0002000, CID: B105E00D, PID: 000BB00B FPB
Connected to target
Waiting for GDB connection...
Server has been shut down.
- Mark as New
- Bookmark
- Subscribe
- Mute
- Subscribe to RSS Feed
- Permalink
- Report Inappropriate Content
Hi Dave,
hard to say what is going wrong.
Suggestions:
- use the 'blue' debug button
- make sure no other debug session is running
- delete the .launch files in your project root (this will trigger a new probe search)
I hope this helps,
Erich
- Mark as New
- Bookmark
- Subscribe
- Mute
- Subscribe to RSS Feed
- Permalink
- Report Inappropriate Content
Thanks Erich - I tried as follows:
- closed MCUXpresso and deleted aall launch configurations for the project
- restarted MCUXpresso, selected the project and opened its main CPP, and clicked on blue debug line in Quickstart panel (per your recommendations)
- I get the probe search/selection dialog, which correctly shows the JLink. I select the Jlink and continue, but...
- Absolutely nothing happens. Nothing in the console window, blue debug icon at top disabled.
- I again click on the blue debug line in the quickstart panel. This time it asks me to select from two choices and I choose the JLink launch I just created.
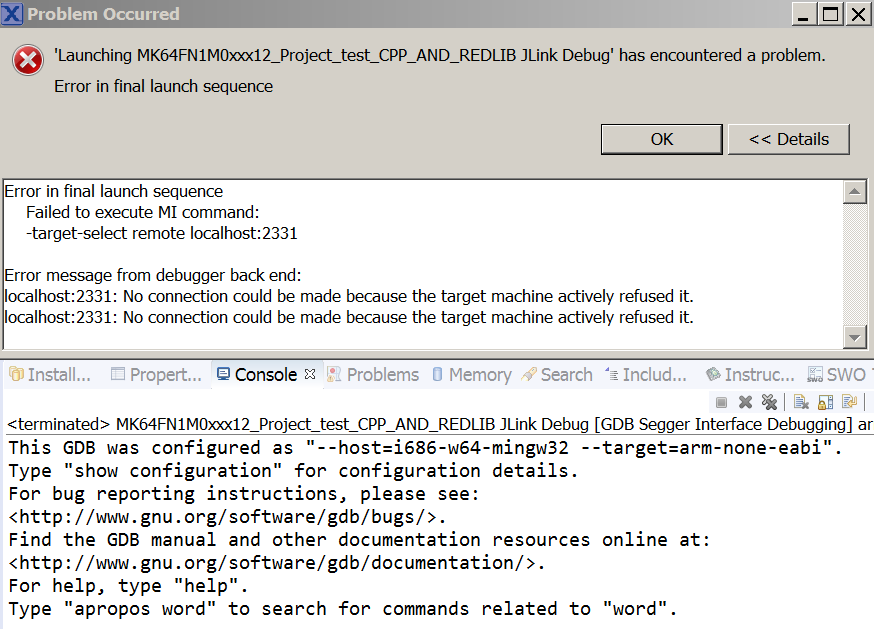
- Now the debug sequence starts and I get a different error:
- I unplugged/replugged JLink, and used JLink-lite to erase the chip (verifying JLink connectivity).
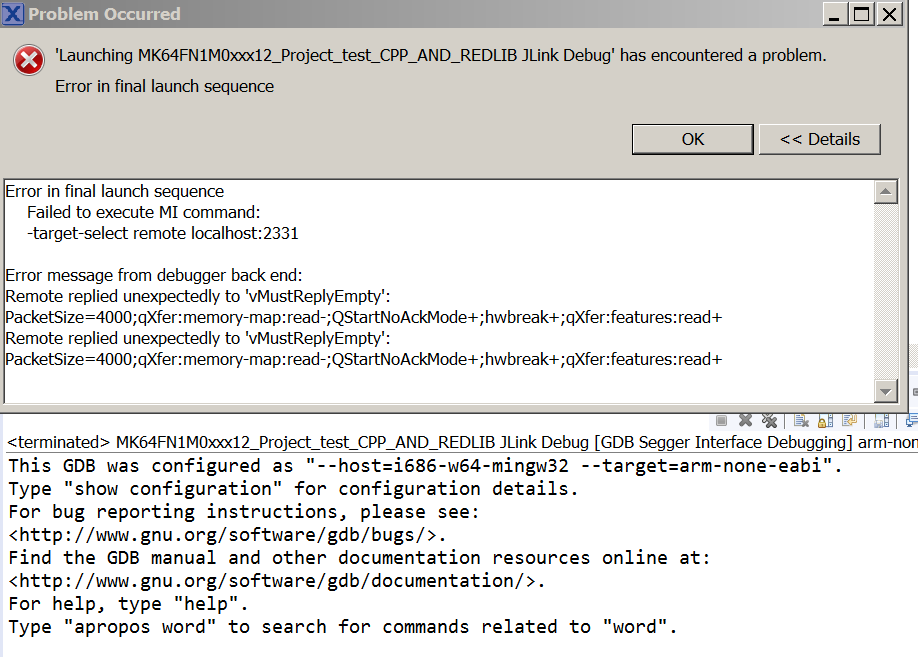
- I tried again and got:
- After retrying 4-5 times (really!!), sometimes doing absolutely nothing and sometimes with the above errors after trying to launch debugger, it finally debugged!
Any idea why this is so erratic?
I don't have this problem with the other project I'm playing with in the same workspace...
Thanks as always for your assistance,
Best Regards, Dave
PS: I just found that, apparently behind my back, MCUXpresso changed library selection from redlib to newlib!
So apparently the issue is with redlib.
This is really annoying...
- Mark as New
- Bookmark
- Subscribe
- Mute
- Subscribe to RSS Feed
- Permalink
- Report Inappropriate Content
Hi Dave,
thanks for all the details, but I have no clue. Can you share that project?
Erich


